a +

Calculating Solar Panel Efficiency: What You Need to Know for Optimal Performance

Industries NewsRelease Time: 2026-07-07

Solar panel efficiency has become one of the most misunderstood specifications in today's PV market. Many buyers choose panels based only on efficiency ratings, only to discover later that real-world energy production falls far below expectations.

In reality, temperature, degradation, system design, and installation quality often have a greater impact than the efficiency number printed on the datasheet.

Market Opportunity

As electricity prices continue to rise worldwide and rooftop space becomes increasingly valuable, maximizing energy output from every square meter has become a top priority for both homeowners and businesses. At the same time, growing demand for energy independence and stronger long-term investment returns is changing how buyers evaluate solar systems.

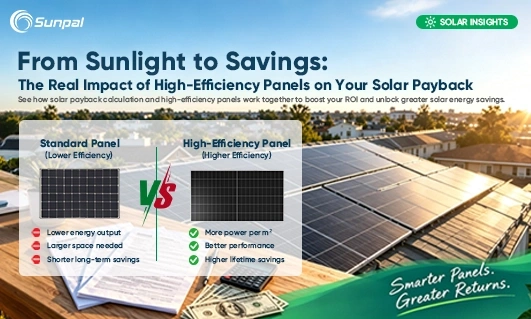
High-efficiency N-type technologies such as high-efficiency solar panels are becoming the market trend, helping users increase energy production, lower electricity costs, and improve project ROI over the system's lifetime.

Today, solar panel efficiency is no longer just a technical specification—it is a key factor that determines lifetime energy production, financial performance, and the overall value of a solar investment.

What Is Solar Panel Efficiency?

Solar panel efficiency measures how effectively a photovoltaic (PV) module converts sunlight into usable electricity.

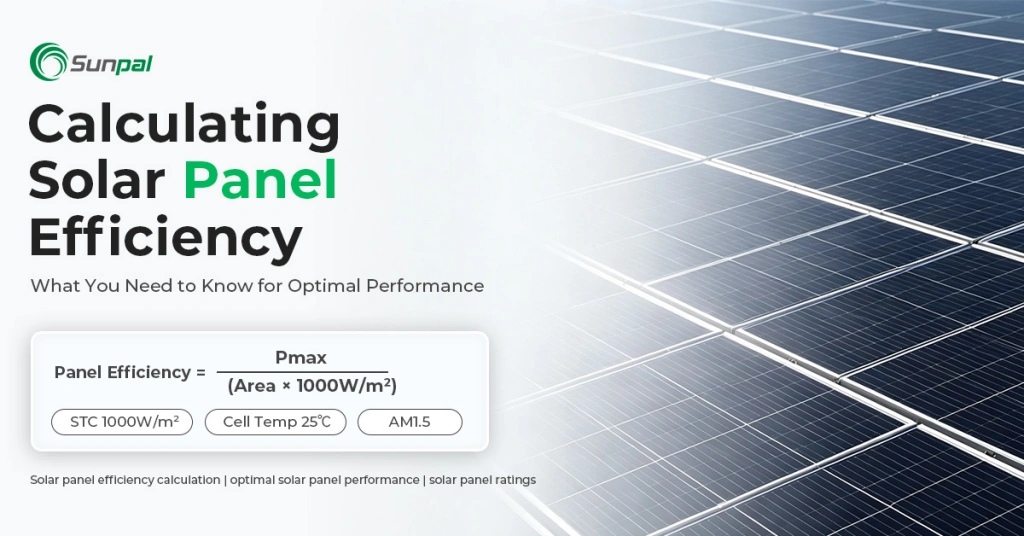
The standard formula for solar panel efficiency calculation is:

Efficiency (%) = Maximum Power Output (W) ÷ (Panel Area × Solar Irradiance) × 100

Under Standard Test Conditions (STC)—defined by international IEC 60904 testing standards—solar panel efficiency is measured under controlled laboratory conditions using:

  • Solar irradiance: 1,000 W/m²
  • Cell temperature: 25°C (77°F)
  • Air Mass: AM1.5

Example Calculation

Suppose a panel has:

  • Maximum output: 450W
  • Panel dimensions: 1.95 m × 1.13 m
  • Panel area: 2.20 m²

Efficiency calculation:

450 ÷ (2.20 × 1000) ×100

= 20.45%

This means approximately 20.45% of incoming solar energy is converted into electricity, while the remaining energy is reflected or lost as heat.

☀️
1000 W/m²
🌡
25°C
🌍
AM1.5

Input Parameters

Maximum Power
0
W
Panel Area
0.00
Solar Irradiance
1000
W/m² (STC)
☀️
1000 W/m²
Solar Panel
450W Max Output
Area: 2.20 m²
⚡⚡⚡⚡⚡

Calculated Efficiency

0%
★★★★★ High Efficiency
15% 18% 20% 22% 24%
Typical Residential Panel | Premium N-Type: 22–24%

Energy Flow Split

Incoming Solar Energy 100%
20.45% Electricity 79.55% Heat & Reflection Loss
Laboratory STC: 20.45%
Actual real-world output depends on:
✓ Temperature & Heat Loss
✓ Daily Irradiance Variation
✓ Roof Installation Angle
✓ Shading & Dust Soiling
✓ Long-Term Panel Degradation
×

STC Standard Irradiance: 1000 W/m²

Standard Test Conditions set fixed solar irradiance at 1000 watts per square meter, simulating bright midday sunlight on a cloudless day. This unified benchmark ensures all solar panel brands can publish comparable efficiency data.

Real-world sunlight rarely hits this value: mornings, evenings and cloudy days deliver far lower irradiance, directly reducing actual power generation.

×

STC Standard Temperature: 25°C

All efficiency ratings are tested at a controlled cell temperature of 25°C. Silicon solar cells lose output as temperature rises, so this cool lab condition creates an ideal maximum performance benchmark.

Rooftop panels in summer often reach 55–70°C, leading to constant power loss that STC ratings do not reflect.

×

Air Mass 1.5 (AM1.5)

AM1.5 defines the standard sunlight spectrum passing through Earth’s atmosphere at a 42° solar angle, the global unified testing spectrum for PV modules per IEC 60904.

Different latitudes, morning/evening sun create different air mass values, shifting real-world panel performance away from lab test results.

×

Maximum Power Output (Pmax, W)

Pmax is the peak wattage a solar panel can produce under full STC lab conditions, printed clearly on every module datasheet. This is the core numerator for solar panel efficiency calculation.

Higher Pmax on identical panel size means higher efficiency, critical for homes with limited rooftop installation space.

×

Solar Panel Surface Area (m²)

Panel area is calculated by multiplying module width × height in meters, representing total light-receiving surface of the solar panel. It is the fixed denominator in the efficiency formula paired with 1000 W/m² irradiance.

Two panels with identical wattage but different sizes will have completely different efficiency percentages.

×

Solar Irradiance Definition

Irradiance measures solar energy striking one square meter, unit W/m². STC locks this value to 1000 W/m² for universal cross-brand panel comparison.

Regional peak irradiance ranges from 600–1100 W/m² based on climate, latitude and seasonal sunlight.

×

How Sunlight Generates Solar Power

Sunlight carries photon energy that hits silicon cells inside PV panels. Photons excite free electrons inside silicon material, creating a continuous direct electric current.

Only a small portion of photon energy converts to usable electricity; most energy dissipates as heat or reflects off panel glass.

×

Photovoltaic Panel Basic Introduction

A solar PV module consists of dozens of wired silicon solar cells, sealed under anti-reflective glass with aluminum frames and a rear junction box for power output.

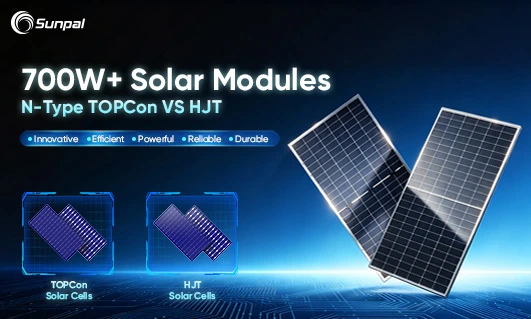
Three mainstream commercial technologies: PERC, N-type TOPCon and HJT, each with distinct efficiency, temperature tolerance and degradation characteristics.

×

Real-World Solar System Loss & Performance Guide

Laboratory STC efficiency is only a theoretical reference. Actual residential solar output suffers multi-layer losses that lower real efficiency to 75%–85% of nameplate ratings.

Key loss sources: high temperature derating, seasonal shading, dust accumulation, wiring conversion loss and long-term annual degradation over 25+ year service life.

Understanding Solar Panel Ratings

Many buyers confuse solar panel ratings with efficiency.

In reality, they describe different aspects of performance.

ParameterWhy It MattersImpact on Real Performance
EfficiencyConversion capabilityAffects power density
WattageRated outputMisleading without context
Temperature CoefficientHeat loss sensitivityCritical in hot climates
Degradation RateLong-term lossDetermines lifetime yield
Power ToleranceManufacturing variationAffects consistency

Looking at wattage alone doesn't provide the complete picture. Two panels with identical wattage may perform differently in real-world conditions due to temperature response and long-term degradation.

What Affects Optimal Solar Panel Performance?

Laboratory efficiency ratings only tell part of the story. According to the U.S. National Renewable Energy Laboratory (NREL), operating temperature, shading, inverter losses, wiring losses, and soiling typically reduce real-world system performance by approximately 15–25% compared with laboratory ratings. This is why overall system design is just as important as module efficiency. Real-world output depends on multiple environmental and installation factors.

1. Operating Temperature

Solar panels become less efficient as temperatures rise. Industry testing shows that crystalline silicon modules typically lose between 0.3% and 0.5% of their output for every 1°C increase above the 25°C STC baseline, depending on the cell technology and temperature coefficient.

Typical temperature coefficients include:

  • PERC: -0.35% to -0.45%/°C
  • TOPCon: -0.30% to -0.35%/°C
  • HJT: -0.24% to -0.29%/°C

In hot climates where module temperatures reach 65°C, panels with lower temperature coefficients maintain significantly higher energy production.

2. Solar Irradiance

Cloud cover, seasons, and geographic location directly affect available sunlight.

Higher irradiance generally leads to greater energy production, although extremely high temperatures can offset some of those gains.

3. Roof Orientation and Tilt

Proper installation is just as important as panel efficiency.

Optimal performance typically comes from:

  • South-facing roofs (Northern Hemisphere)
  • Tilt angle close to local latitude
  • Minimal shading throughout the day

Poor orientation can reduce annual energy production by 10–30%.

4. Dirt and Dust Accumulation

Dust, pollen, bird droppings, and pollution reduce the amount of sunlight reaching the cells.

Regular cleaning helps maintain optimal solar panel performance, particularly in dry or agricultural regions.

5. System Design

Panel efficiency alone cannot compensate for poor system engineering.

Performance also depends on:

  • Inverter efficiency
  • String design
  • Cable losses
  • Shading analysis
  • MPPT optimization

A well-designed system with slightly lower-efficiency panels often outperforms a poorly designed system using premium modules.

☀️
☁️
☁️
☁️

What Affects
Optimal Solar Panel Performance?

Laboratory efficiency is only the beginning.
Real-world solar output depends on temperature, irradiance, installation quality,
and complete system engineering.

How Sunlight Turns Into Electricity

PV Panel
Sunlight ↓
Electricity

5 Core Factors That Control PV Output

🌡
Temperature
Irradiance
🏠
Roof Angle
🧹
Soiling & Dust
System Design

Hover each card to dive into dynamic performance changes

1. Operating Temperature Loss

Higher heat reduces power output; N-type cells have far weaker temperature attenuation

25°C : 100% Power
65°C : 88% / 91% / 95% (PERC/TOPCon/HJT)
Optimization Tip: Improve ventilation beneath modules to lower operating cell temperature.

2. Solar Irradiance Variation

Cloud coverage directly cuts the sunlight energy hitting PV surfaces

☁☁☁
Clear Sky: 100% Output
Partial Cloud: 82% / 55%
Heavy Overcast: 30%
Optimization Tip: Select bifacial panels to capture reflected ground light under low irradiance.

3. Roof Orientation & Tilt

Northern Hemisphere south-facing roofs deliver maximum annual yield

South: 100% ✅
East: 92% | West:90% | North:70%
Optimization Tip: Set tilt angle matching local latitude during system layout design.

4. Dust & Soiling Loss

Pollution, pollen and bird waste block sunlight; regular cleaning restores full performance

Dirty Panel: 78% Power
After Washing: 99% Power
Optimization Tip: Schedule quarterly cleaning cycles in dry, dusty agricultural zones.

5. Complete PV System Engineering

High-efficiency panels fail to perform with poor string & inverter matching

Poor Design

Low-grade MPPT
Mismatched String Lengths
Long Thin Cables (High Loss)
No Shading Pre-Analysis
75% Actual Output

Optimized Design

Multi-channel Smart MPPT
Balanced String Configuration
Low-Resistance Heavy Gauge Wire
Full Shading Simulation
97% Actual Output

Same Panels — Totally Different Real-World Results

Optimization Tip: Match each string’s voltage range to inverter MPPT operating window.

Full System Real-World Loss Breakdown

100% STC Rated Power
-3% Cell Temperature Loss → 97%
-2% Cable Transmission Loss → 95%
-2% Inverter Conversion Loss → 93%
-3% Dust & Soiling Loss → 90%
Final Actual Output: 87%

High Module Efficiency Peak lab power output under STC 1000W/m², 25°C AM1.5 test standard
+
Professional System Design Optimized string, inverter MPPT, tilt & shading layout to minimize real-world power attenuation
=
Maximum Lifetime Energy Yield Total kWh generated over 25+ year panel service life, core metric for solar ROI

NREL VerifiedU.S. National Renewable Energy Laboratory authoritative PV performance test standard IEC 61215International safety & durability certification for crystalline PV modules IEC 61730PV module safety qualification standard for global grid connection STCStandard Test Conditions: 1000W/m² irradiance, 25°C cell temp, AM1.5 spectrum NOCTNominal Operating Cell Temperature, real ambient working temperature benchmark Temperature Coefficient% power lost per 1°C cell temperature rise above 25°C Annual DegradationYearly power attenuation rate of solar panels (0.3~0.5% for N-type) Bifacial GainExtra power from reflected ground light captured by double-sided PV cells MPPTMaximum Power Point Tracking, inverter tech to lock peak panel output Performance Ratio (PR)Ratio of actual generated energy vs theoretical STC rated yield Specific Yield (kWh/kWp)Annual energy output per kilowatt peak installed capacity LCOELevelized Cost of Electricity, total lifetime solar energy generation cost ROIReturn on Investment, payback cycle calculation for residential & commercial PV Energy YieldTotal usable AC electricity produced by the full PV system yearly
Get Your Free Custom PV Design

Interactive Expected Performance Loss Calculator

Drag sliders to adjust environment factors and view real-time predicted power output

25°C
Light Dust
South-Facing (Optimal)
No Shading
Predicted Real-World Power Output: 98.2%

PV Cell Technology Dynamic Comparison

Compare temperature attenuation, degradation, bifacial gain and long-term performance

Cell Tech Temperature Coefficient 25-Year Total Degradation Bifacial Power Gain High-Temp Output (60°C)
PERC Mono -0.35 ~ -0.45 %/°C ~14% 8~12% 87%
N-type TOPCon -0.30 ~ -0.35 %/°C ~10% 10~15% 92%
N-type HJT -0.24 ~ -0.29 %/°C ~7.5% 12~18% 96%

Data Source & Reference Standard

U.S. National Renewable Energy Laboratory (NREL) PV System Performance Research Report | IEC 60904 Global PV Module Test Specification | Sunpal N-Type Module Long-Term Field Test Database

Comparing Today's Solar Panel Technologies

TechnologyTypical EfficiencyAdvantagesBest Applications
PERC19–21%Lower costStandard residential
TOPCon21–23%Better low-light performance, lower degradationResidential & C&I
HJT22–24%Excellent temperature performance, highest lifetime yieldUtility-scale, hot climates
Thin Film10–18%Lightweight, flexibleSpecialized commercial projects

TOPCon has become the mainstream choice for many rooftop installations, while HJT continues to gain popularity in projects prioritizing long-term energy yield.

As the solar industry continues transitioning toward N-type technologies, Sunpal offers a comprehensive portfolio of high-efficiency TOPCon and HJT solar panels designed for superior real-world performance. Compared with conventional PERC modules, Sunpal's advanced N-type products deliver lower temperature coefficients, slower annual degradation, and higher lifetime energy yield, making them an excellent choice for residential, commercial, and utility-scale projects.

Efficiency vs. Energy Production

Solar panel efficiency refers to how effectively a photovoltaic (PV) module converts sunlight into usable electricity under defined conditions.

Not necessarily.

Consider two systems:

System A

  • 20% efficiency
  • Large roof
  • 20 panels

System B

  • 22% efficiency
  • Same roof
  • 20 panels

System B generates roughly 10% more capacity from the same roof area.

However, if roof space is unlimited, adding one or two extra standard panels may produce similar energy at a lower overall cost.

This is why installers often evaluate both cost per watt and available installation space rather than focusing solely on efficiency percentages.

Long-Term Performance Matters Too

Initial efficiency is only part of the investment equation.

Solar panels gradually lose output over time due to normal material aging, thermal cycling, and prolonged UV exposure. Long-term field studies conducted by NREL and other international research organizations show that modern N-type modules generally experience slower degradation than conventional P-type technologies, resulting in higher lifetime energy production.

Typical annual degradation rates:

TechnologyAnnual DegradationRemaining Output After 25 Years
PERC0.45–0.55%85–88%
TOPCon0.35–0.40%89–91%
HJT0.25–0.30%Up to 94%

Lower degradation means higher lifetime energy production and improved return on investment.

Commercial Value of High-Efficiency Panels

High-efficiency solar panels deliver more than higher power output—they improve the economics of the entire solar project. By generating more electricity from the same installation area, they maximize the value of limited roof or land space while reducing Balance of System (BOS) costs and lowering the levelized cost of energy (LCOE). This enables developers to achieve higher energy production without significantly increasing installation costs.

The financial benefits continue throughout the system's lifetime. Higher energy yield improves project cash flow, shortens the investment payback period, and increases return on investment (ROI) and internal rate of return (IRR). For commercial, industrial, and utility-scale projects, even a small gain in module efficiency can translate into substantial additional revenue over 25 years, making high-efficiency panels a smarter long-term investment, especially for space-constrained C&I rooftops and utility-scale land optimization projects.

Case Study: Improving Energy Yield with High-Efficiency Modules

A manufacturing facility in Texas, USA planned to deploy a rooftop solar system but faced limited installation space while aiming to maximize long-term energy savings and financial returns. Expanding the roof area was not an option, making module efficiency a key factor in the project design.

After comparing module efficiency, temperature coefficient, degradation rate, and projected lifetime energy yield, the engineering team selected Sunpal TOPCon solar panels.

The result included:

  • Approximately 8% higher installed capacity without expanding the roof area
  • Over 780MWh of annual electricity generation from the 500kW system
  • Improved performance during high-temperature summer conditions
  • Faster return on investment due to greater energy output

This demonstrates why efficiency should be evaluated alongside installation constraints rather than viewed as a standalone specification.

Choosing the Right Solar Panel

When comparing solar panels, efficiency alone should not be the deciding factor. Real project performance depends on how all technical and financial parameters work together under actual operating conditions.

Instead, buyers should evaluate a combination of factors, including module efficiency, temperature coefficient, annual degradation rate, warranty terms, cost per watt, manufacturer reliability, and site-specific installation conditions.

A well-balanced selection ensures higher lifetime energy output, better system stability, and stronger overall project economics. The best solar panel is therefore not the one with the highest laboratory efficiency, but the one that delivers the greatest long-term value under real-world conditions.

Conclusion

Understanding solar panel efficiency helps buyers make informed investment decisions instead of relying solely on claims. While efficiency is an important benchmark, real-world performance also depends on factors such as climate, system design, installation quality, and long-term reliability.

As N-type technologies continue to become more affordable, selecting the right balance of efficiency, durability, and lifetime energy yield is the key to maximizing long-term returns. Sunpal provides high-efficiency solar modules backed by professional engineering support for residential, commercial, and utility-scale projects. Whether you're comparing TOPCon and HJT technologies or planning a new installation, our team can recommend the best solution based on your energy goals and budget.

Contact Sunpal today for a free consultation and customized solar solution.

Frequently Asked Questions

What is a good solar panel efficiency rating in 2026?

Most high-quality residential solar panels offer efficiencies between 20% and 23%, while premium HJT modules can exceed 24%.

Does higher efficiency always produce more electricity?

Only when the installation area is limited. If roof space is abundant, adding additional standard-efficiency panels may deliver similar total output at a lower cost.

Why is solar panel efficiency lower in summer?

Higher operating temperatures increase electrical resistance inside solar cells, reducing output despite stronger sunlight.

What is the most important factor besides efficiency?

Temperature coefficient, degradation rate, installation quality, and overall system design have a major impact on real-world energy production.

How can I improve my solar panel's performance?

Maintain clean panel surfaces, minimize shading, optimize tilt and orientation, use quality inverters, and choose modules with low degradation and excellent temperature performance.

Free to contact us