Минулого листопада я стояв на складі модулів за межами Шанхая, коли керівник виробництва сказав мені щось таке, що у мене аж серце стиснулося: “Ми працюємо на повну потужність 140%, але все одно не встигаємо розпродавати запаси”.”
Він не скаржився на попит. Світ хоче сонячну енергію. Він описував ринок, який фундаментально зруйнований — де виробники випускають рекордні обсяги, ціни впали до рівнів, про які ніхто не міг подумати п’ять років тому, і все ж уся галузь готується до, можливо, найруйнівнішої торгової війни в історії чистої енергетики.
Якщо ви шукаєте модулі для комерційних проєктів у 2025 році, ви орієнтуєтесь у сфері, яка зовсім не схожа на ту, якою вона була 18 місяців тому. Правила змінилися. Технології зробили стрибок. А геополітика? Ну, скажімо так, фраза “стійкість ланцюга поставок” перетворилася з модного слова з PowerPoint на питання, що стосуються самого існування бізнесу.
Ось таким буде стан справ у сонячній енергетиці у 2025 році. Ситуація хаотична, нестабільна і розвивається швидше, ніж хтось міг передбачити. До кінця 2024 року сумарна потужність фотоелектричних установок у світі перевищила 2,2 ТВт, після того як протягом 2024 року було введено в експлуатацію 554–602 ГВт нових потужностей. У 2024 році на сонячних електростанціях було вироблено близько 71 ТП3Т електроенергії.
Коли занадто багато хорошого стає проблемою
Ось протиріччя, яке лежить в основі сонячної галузі просто зараз: у нас ніколи не було більших виробничих потужностей, і водночас у нас ніколи не було більшої невизначеності щодо того, чи будуть проєкти фактично побудовані.
Глобальні виробничі потужності модулів вибухово зросли, головним чином завдяки китайському виробництву, яке додавало гігават за гігаватом нових ліній. Результат? Ціни на модулі досягли історичних мінімумів. Для забудовників та комерційних покупців це має бути чудовою новиною. І в короткостроковій перспективі це так – якщо ви зможете орієнтуватися в хаосі.
Але ось що відбувається під поверхнею.
Європейські та американські виробники зазнають краху. Вони не можуть конкурувати за ціною з китайськими надлишковими потужностями, що заповнюють ринок. Індійські виробники опинилися посередині, намагаючись наростити внутрішнє виробництво, водночас втрачаючи від імпорту. Економічна реальність жорстока: якщо ви не є частиною величезної, гіпер-ефективної китайської виробничої екосистеми, ви втрачаєте гроші.
Це викликало саме ту політичну реакцію, яку можна було очікувати. Протекціонізм повернувся з новою силою.
У Сполучених Штатах загроза введення нових мит спричиняє справжній хаос у плануванні проектів. Аналітика з різних галузевих джерел свідчить, що у разі впровадження агресивної митної політики США можуть втратити до 60 ГВт запланованої потужності сонячних електростанцій. Це неабияка цифра — це еквівалентно приблизно 151 ТП3Т існуючої встановленої потужності країни, яка просто… зникне, оскільки проекти більше не будуть економічно вигідними.
Подумайте, що це означає, якщо ви намагаєтеся укладати угоди прямо зараз. Ваші клієнти бачать неймовірні ціни на модулі, але бояться, що ці ціни зникнуть одного дня, коли введуть мита. Або, що ще гірше, вони підпишуть контракти за нинішніми цінами, але побачать, що проєкти стануть економічно невигідними через шість місяців, коли зміниться політика.
Це та прогулянка по канатній дорозі, яку робить кожен.
Марокканська стратегія (і чому географія знову стає доленосною)
Китайські виробники не сидять склавши руки, чекаючи, поки західні уряди визначаться зі своєю торговельною політикою. Вони адаптуються, і роблять це швидко.
Марокко стає одним із найцікавіших шахових ходів у глобальному ланцюгу постачання сонячної енергії. Чому саме Марокко? Три причини, які мають значення: воно має угоди про вільну торгівлю як зі Сполученими Штатами, так і з Європейським Союзом, має сприятливі умови для інвестицій, і географічно розташоване для обслуговування як атлантичного, так і європейського ринків, не викликаючи такої ж політичної реакції, як прямий китайський експорт.
Китайські енергетичні компанії активно створюють там виробничі бази. Йдеться не просто про складальні цехи – це вертикально інтегроване виробництво, яке може заслужено претендувати на походження “Зроблено в Марокко”, водночас використовуючи китайський виробничий досвід і капітал.
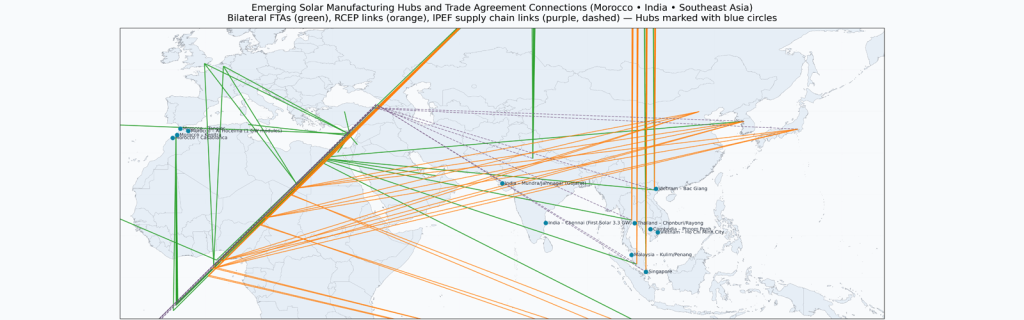
Це майбутнє сонячного виробництва: не скасування глобалізації, а географічна диверсифікація, розроблена для навігації у все більш фрагментованому торговому середовищі. Ланцюжок поставок не відходить від Китаю; він множиться на регіональні центри, які можуть отримати доступ до різних ринків.
Для покупців оптові двоскляні модулі HJT 700 Вт для комерційних проєктів, це надзвичайно важливо. Тепер ви оцінюєте не тільки технічні характеристики та ціни. Ви оцінюєте ризики ланцюга постачання. Чи зможе ваш постачальник стабільно постачати продукцію протягом наступних 24-36 місяців, коли торговельні політики змінюватимуться? Чи мають вони виробничі потужності, які забезпечують їм гнучкість? Чи достатньо вони диверсифіковані, щоб витримати політичні збої?
Це не ті питання, які хтось ставив у 2022 році. Це перші питання, які ви повинні поставити у 2025 році.
Технологічна революція, що відбувається на наших очах
Поки всі зосереджені на тарифах та надлишкових потужностях, розгортається паралельна історія, яка, можливо, є більш важливою в довгостроковій перспективі: сонячні технології роблять стрибки поколінь.
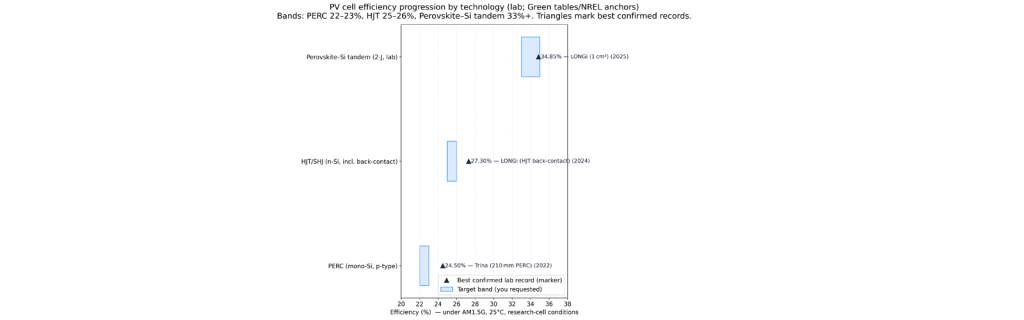
Протягом останнього десятиліття технологія PERC була основною рушійною силою галузі. Вона надійна, добре вивчена та досконало оптимізована. Ефективність комерційних модулів досягла максимуму на рівні 22–23 % (TP3T), і цього було цілком достатньо для більшості сфер застосування.
Ця стеля зараз руйнується.
Технологія гетеропереходу (HJT) перейшла від перспективної ніші до основного високопродуктивного варіанту швидше, ніж очікували більшість спостерігачів галузі. Такі компанії, як Huasun, масштабують глобальні ланцюги постачання, спеціально розроблені навколо продуктів HJT, а показники ефективності, яких вони досягають, — це не поступові покращення, а категорійні стрибки.
У грудні 2024 року німецький виробник NexWafe досяг ефективності перетворення енергії на рівні 261 TP3T завдяки технології епітаксіальних пластин, оптимізованій для сонячних елементів HJT. І це в умовах серійного виробництва, а не в лабораторії. Ефективність у 26 % у комерційних модулях кардинально змінює економічну ефективність кожного проекту, до якого вона застосовується.
Але ось що більшість людей не помічають у HJT: перевага ефективності — це лише частина історії.
Модулі HJT мають кращі температурні коефіцієнти, тобто вони втрачають менше енергії в умовах високих температур. Їхній коефіцієнт двостороннього використання перевищує 90%, тому вони вловлюють відбите світло з тильної поверхні, яке модулі PERC здебільшого втрачають. А їхній коефіцієнт деградації — тобто те, наскільки знижується їхня продуктивність щороку — приблизно вдвічі менший, ніж у модулів PERC.
Коли ви робите повний аналіз життєвого циклу економічної ефективності оптових двосторонніх HJT модулів потужністю 700 Вт для комерційних проєктів, математика виглядає зовсім інакше, ніж при стандартному закупівель PERC. Так, початкові витрати вищі. Але загальна енергія, вироблена протягом 25-30 років? Різниця величезна.
Саме це зараз усвідомлюють вибагливі покупці. Розумні гроші не женуться за найнижчою ціною модуля; вони женуться за найнижчою зведеною вартістю енергії за весь термін експлуатації проєкту.
Коротка зупинка на перовскіті (бо майбутнє ближче, ніж ви думаєте)
Мені потрібно згадати перовськітно-кремнієві тандемні комірки, навіть якщо вони ще не зовсім комерційні, тому що вони змінять ринок протягом 36 місяців.
Ефективність лабораторних сонячних елементів на сьогодні перевищує 331 ТП3Т. Задумайтеся над цим на мить. Мова йде про підвищення ефективності на 501 ТП3Т порівняно з нинішньою комерційною технологією PERC. Фізика працює. Складність полягає в масштабуванні технології, забезпеченні довгострокової стабільності та зниженні виробничих витрат до комерційно вигідного рівня.
Прямо зараз анонсуються перші багатогігаватні лінії з виробництва тандемних елементів. Ця технологія – це наступний великий стрибок, який будується на виробничій інфраструктурі HJT. Компанії, які сьогодні інвестують у виробництво HJT, позиціонують себе як першопрохідці, коли тандемна технологія досягне комерційної життєздатності.
Чому це важливо для рішень щодо закупівель сьогодні? Тому що виробники, які лідирують у HJT, є тими ж, хто буде лідирувати в тандемі. Якщо ви будуєте відносини з постачальниками на наступне десятиліття комерційних проєктів, вам потрібні партнери, які інвестують у передові технології, а не просто оптимізують виробничі процеси минулого.
Це стратегічний пошук постачальників, а не просто закупівля модулів.
Перевага подвійного скла, про яку недостатньо говорять
Давайте поговоримо про те, чому двошаровий скляний конструктив має значення, адже це одна з тих непривабливих інженерних деталей, які мають величезні довгострокові наслідки.
Традиційні модулі використовують скло спереду та полімерний захисний шар ззаду. Цей захисний шар є ахіллесовою п’ятою модуля. Піддаючись десятиліттям УФ-випромінювання, температурних циклів і вологи, він з часом деградує. Коли це трапляється, волога проникає в модуль. Волога означає корозію, що означає гарячі точки, збої байпасних діодів і, зрештою, катастрофічний збій.
Подвійне скло повністю усуває цей режим відмови. Ви замінюєте органічний матеріал, який руйнується, неорганічним матеріалом, який не руйнується. Інженерне рішення просте; наслідки — глибокі.
Польові дані з інсталяцій, що використовують двошарові модулі, демонструють значно нижчий рівень відмов з часом. Це безпосередньо призводить до зниження витрат на експлуатацію та обслуговування, меншої кількості аварійних ремонтів та більш передбачуваного виробництва енергії протягом життєвого циклу проєкту.
| Порівняльна таблиця показників відмов та гарантійних претензій для модулів зі скляною задньою стороною проти двоскляних модулів на основі 10-річних польових даних, зібраних Sunpal Solar | |||
| Метрика | Скляно-задньолистні модулі | Склопакети (скло//скло) | Примітки, обсяг та джерела |
| Типова річна норма відмови модуля, що замінюється (усі технології, парки 2000–2015 років) | Середній показник ≈ 0,051 TP3T модулів, що замінюються щороку; загалом характерний для автопарків, сформованих після 2000 року. | Та сама базова статистика застосовується до всього флоту; не розділена за конструкцією. | Мета-огляд NREL 4500 модулів та ~50 000 систем визначає “відмову” як заміну; розподіл за конструкцією не надається. Використовуйте це як орієнтовну основу. |
| Поширеність дефектів специфічних для задньої плівки за роками 6–10 | Результати польових досліджень свідчать про значну кількість дефектів задньої плівки у старих партіях: загальна кількість дефектів задньої плівки становить приблизно 141 на 3000 (2019 р.) та 161 на 3000 (2020 р.) перевірених модулів; кількість тріщин у зовнішньому шарі PVDF зросла з приблизно 51 на 3000 на 4-му році до приблизно 231 на 3000 на 9-му році. Неодноразово фіксувалися випадки тріщин у шарі PA/PET. Не всі дефекти вимагають негайної заміни, але вони призводять до повернення продукції з міркувань безпеки та до гарантійних дій. | Не застосовується (без заднього покриття), але ранні двосторонні скляні установки на деяких об'єктах стикалися з випадками розшарування/розтріскування, що походить від краю. | Випробування на полях Multi‑GW DuPont; постачальник, але широко цитується. Лабораторні дослідження Fraunhofer ISE щодо потрісканих задніх поверхонь пов'язують з відмовами ізоляції. DuPont також спостерігав розшарування в багатьох двоскляних установках. |
| Ризик безпеці ізоляції, пов'язаний з відмовою упаковки | Спостерігалися збої від вологого витоку (WL), де прогресувало розтріскування заднього покриття; в одному зразку Fraunhofer ISE значна частка модулів з потрісканим заднім покриттям не відповідала вимогам щодо вологого витоку (WL). | Скло//скло усуває ризик розтріскування полімерної задньої панелі; проблеми ізоляції зміщуються до цілісності крайового ущільнення/скла та розподільної коробки. | Детальний аналіз 279 модулів з 26 заводів від Fraunhofer ISE; цільова вибірка проблемних заводів, а не випадкова ставка по всьому парку. |
| Град та схильність до механічного руйнування (прискорені випробування як замінник польових умов) | За результатами випробувань PVEL на стійкість до граду, комбінація «скло/задня плівка» товщиною 3,2 мм продемонструвала меншу кількість пошкоджень, ніж комбінація «скло/скло» товщиною 2,0 мм при граду розміром 50 мм (≈401 TP3T проти 891 TP3T у наборі даних за 2024 рік). | 2.0//2.0 мм скло//скло показало помітно вищий рівень розбиття порівняно зі склом 3.2 мм//задня панель під час великого граду; конструкції зі склом 2.5//2.5 або 3.2//2.0, “загартовані градом”, підвищують стійкість. | Товщина скла має більше значення, ніж самі “двокамерні склопакети”. Ризик розбиття в польових умовах зріс через збільшення розмірів і зменшення товщини скла. |
| Стійкість до вологи/тепла (прискорене вологе тепло) | Більші середні втрати потужності порівняно з двошаровим склом у DH: середнє зниження продуктивності становить приблизно 1,91 TP3T (PVEL, 2023). | Нижча середня втрата вологи ≈1,01 ТП3Т (2023 PVEL), що свідчить про кращий захист від вологи. | Прискорені випробування, але тенденція узгоджується з меншим ризиком проникнення вологи в подвійному склі. |
| Поширені причини відмов у польових умовах протягом 10 років | Задня покришка, що крейдується → розтріскування (ПЕ, ПВДФ, деякі сімейства ПЕТ), розшарування, пожовтіння герметика під дією УФ → витоки; PID у деяких партіях; проблеми з розподільною коробкою/кабелем; розбиття скла від граду/сміття. | Розшарування крайового ущільнення, розбиття заднього скла (від граду, при обробці), проблеми з розподільчою коробкою; зазвичай менше пожовтіння/побуріння, спричинене вологою; часто зменшене поширення тріщин у комірках (нейтральна площина), що сприяє збереженню потужності. | Синтезовано з IEA PVPS Task 13, Fraunhofer, польових нотаток DuPont та трендів PVEL. |
| Гарантійний запит (публічний) | Відкритих даних про порівняльні показники кількості претензій за 10 років майже немає. Аналіз конкретних випадків та досліджень на сонячних електростанціях у посушливих регіонах США, де спостерігається відшарування задньої плівки, показує, що 0,5–1,71 % модулів підпадають під умови повернення з міркувань безпеки, причому значна частка модулів у цій групі підлягає претензіям щодо продуктивності (залежно від конкретного випадку). | Недостатньо публічної 10-річної статистики щодо претензій за типом будівництва; власники повідомляють про претензії, коли з'являються проблеми з крайовим ущільненням або склом, або після граду; багато претензій залежать від положень щодо якості виконання робіт порівняно з положеннями щодо експлуатаційних характеристик. | Цифри щодо страхових випадків відображають ситуативну картину, а не середні показники по всьому автопарку. У галузі, як правило, не оприлюднюють показники частоти страхових випадків; з документів, поданих до Комісії з цінних паперів та бірж (SEC), випливає, що деякі виробники автомобілів відкладають близько 11 TP3T від обсягу продажів на гарантійні зобов’язання, що свідчить про низьку, але не нульову частоту страхових випадків. |
| Погляд на системному рівні на те, “як часто проблеми виникають через модулі” | У великих масивах даних з експлуатації та технічного обслуговування частка втрат енергії, пов’язаних із несправностями модулів, є незначною порівняно з втратами, спричиненими системами BoS та інверторами, проте вона зростає; за даними глобального масиву даних повітряних обстежень за 2023 рік, втрати, пов’язані з модулями, становлять приблизно 4–51 TP3T від загального обсягу. | Схожа перспектива; конструкція впливає на сукупність питань (наприклад, задня частина проти скла). | Raptor Maps/PV‑Tech повідомляє про інспекції потужністю в кілька гігават. Це не показник відмов, але корисно для контекстуалізації джерел збитків. |
| Планування сонячних модулів за кліматичними зонами та ризиком граду | |||
| Кліматична зона | Опис | Град | Скло-задня панель: 10-річна сукупна гарантія на заміну % |
| Жарко-волого | Висока температура (у середньому >25 °C), висока вологість (відносна вологість >60 %), вплив ультрафіолетового випромінювання — від помірного до сильного | Низький | 1,0–2,51 ТП3Т |
| Жарко-волого | Висока температура (у середньому >25 °C), висока вологість (відносна вологість >60 %), вплив ультрафіолетового випромінювання — від помірного до сильного | Помірний (від 25–50 мм зазвичай) | 1,5–3,51 ТП3Т |
| Жарко-волого | Висока температура (у середньому >25 °C), висока вологість (відносна вологість >60 %), вплив ультрафіолетового випромінювання — від помірного до сильного | Високі (>50 мм події) | 2,0–5,01 ТП3Т |
| Гаряче-Сухе | Висока температура (середня >25 °C), низька вологість (відносна вологість <40%), дуже високий рівень ультрафіолетового випромінювання | Низький | 0,8–2,01 ТП3Т |
| Гаряче-Сухе | Висока температура (середня >25 °C), низька вологість (відносна вологість <40%), дуже високий рівень ультрафіолетового випромінювання | Помірний (від 25–50 мм зазвичай) | 1,2–3,01 ТП3Т |
| Гаряче-Сухе | Висока температура (середня >25 °C), низька вологість (відносна вологість <40%), дуже високий рівень ультрафіолетового випромінювання | Високі (>50 мм події) | 2,5–6,01 ТП3Т |
| Помірний | Помірна температура (в середньому 10–20°C), помірна вологість, сезонна мінливість, помірний УФ-індекс | Низький | 0,4–1,01 ТП3Т |
| Помірний | Помірна температура (в середньому 10–20°C), помірна вологість, сезонна мінливість, помірний УФ-індекс | Помірний (від 25–50 мм зазвичай) | 0,8–2,01 ТП3Т |
| Помірний | Помірна температура (в середньому 10–20°C), помірна вологість, сезонна мінливість, помірний УФ-індекс | Високі (>50 мм події) | 1,5–4,01 ТП3Т |
| Холодно | Низька температура (в середньому <10°C), сезонний сніг, циклічне заморожування-розморожування, нижчий УФ (вища широта) | Низький | 0,3–0,81 ТП3Т |
| Холодно | Низька температура (в середньому <10°C), сезонний сніг, циклічне заморожування-розморожування, нижчий УФ (вища широта) | Помірний (від 25–50 мм зазвичай) | 0,6–1,51 ТП3Т |
| Холодно | Низька температура (в середньому <10°C), сезонний сніг, циклічне заморожування-розморожування, нижчий УФ (вища широта) | Високі (>50 мм події) | 1,2–3,51 ТП3Т |
| Прибережний | Солоний бриз, вологість, помірне ультрафіолетове випромінювання; температура залежить від широти | Низький | 1,0–2,51 ТП3Т |
| Прибережний | Солоний бриз, вологість, помірне ультрафіолетове випромінювання; температура залежить від широти | Помірний (від 25–50 мм зазвичай) | 1,5–3,51 ТП3Т |
| Прибережний | Солоний бриз, вологість, помірне ультрафіолетове випромінювання; температура залежить від широти | Високі (>50 мм події) | 2,5–5,51 ТП3Т |
| Подвійне скло: 10-річна сукупна частота заміни % | Ключові драйвери (скло-задня панель) | Ключові драйвери (подвійне скло) | Рекомендація |
| 0,5–1,21 ТП3Т | Тріщини/розшарування задньої плівки (PA, деякі PVDF/PET); проникнення вологи; потемніння герметика; ризик PID | Проблеми з ущільненням країв; корозія монтажної коробки; мінімальний ризик для задньої плівки | Надавайте перевагу двошаровому склу або преміальній зворотній обшивці (фторполімерна багатошарова); уникайте зворотних обшивок на основі поліаміду |
| 1,5–3,01 ТП3Т (2,0//2,0 мм); 0,8–1,81 ТП3Т (загартована проти граду) | Задня захисна плівка + розбиття скла, спричинене градом | Розбиття скла заднього виду градом (залежно від товщини); напруга крайового ущільнення | Використовуйте загартоване скло (≥2,5//2,5 мм) або скло//задню панель товщиною 3,2 мм; щорічно перевіряйте задню панель |
| 3,0–7,01 ТП3Т (2,0//2,0 мм); 1,5–3,51 ТП3Т (захищений від граду) | Стихійні градівки домінують; другий шар - задній настил | Розбиття заднього скла; уникайте 2.0//2.0 мм | Обов'язкові конструкції, загартовані градом (3,2//2,5 мм або краще); страхування/гарантії є критично важливими |
| 0,4–1,01 ТП3Т | УФ-спричинене вивітрювання/розтріскування задньої плівки (особливо зовнішнього шару з ПВДФ); пожовтіння герметика | Мінімальна вологість; УФ на торцевому ущільненні; термічні цикли напруження | Двокамерне або УФ-стійке заднє покриття; уникайте ранніх версій PVDF; сертифікація термічного циклу важлива |
| 1,2–2,51 ТП3Т (2,0//2,0 мм); 0,6–1,51 ТП3Т (захищений від граду) | УФ + град | Град на задньому склі; термічний шок після граду | Перевага надається загартованому склопакету, який витримує град; стійке до УФ покриття краю є критично важливим |
| 3,5–8,01 ТП3Т (2,0//2,0 мм); 1,8–4,01 ТП3Т (захищений від граду) | Град домінує; УФ прискорює деградацію після пошкодження | Розбиття заднього скла | 3.2//2.5 мм або 3.2//3.2 мм дизайн; страхування від граду є обов'язковим |
| 0,3–0,81 ТП3Т | Базове старіння; ризик зворотного листа нижчий, ніж у спекотному кліматі, але все ще присутній (заморожування-розморожування може призвести до розтріскування старого зворотного листа) | Базове старіння; роботоздатність крайового ущільнення в умовах циклів заморожування-відтаювання | Обидві конструкції працюють добре; обирайте залежно від вартості та ризику граду. |
| 1,0–2,21 ТП3Т (2,0//2,0 мм); 0,5–1,21 ТП3Т (захищений від граду) | Випадок граду; старіння заднього листа вторинний | Пошкодження заднього скла градом | Загартоване подвійне скло або скло товщиною 3,2 мм // задня панель, якщо град поширений |
| 2,5–6,01 ТП3Т (2,0//2,0 мм); 1,2–3,01 ТП3Т (загартована проти граду) | Град панує | Розбиття заднього скла; товщина критична | Обов'язкові конструкції, стійкі до граду; мінімум 3,2//2,5 мм |
| 0,3–0,71 ТП3Т | Циклічне заморожування-відтаювання може спричинити напруження на старих підкладках; волога становить меншу проблему завдяки холоду | Заморожування-розморожування на ущільненні кромки; механічне напруження від снігового навантаження | Обидва працюють добре; переконайтесь у сертифікації IEC 61215 TC200 або посиленому термічному циклі |
| 0,8–1,81 ТП3Т (2,0//2,0 мм); 0,4–1,01 ТП3Т (загартована проти граду) | Град + розморожування | Пошкодження заднього скла від граду; крихкість при низьких температурах | Загартований ударостійким склом подвійний склопакет; перевірити стійкість до низькотемпературних ударів |
| 2,0–5,01 ТП3Т (2,0//2,0 мм); 1,0–2,51 ТП3Т (загартована проти граду) | Град панує | Розбиття заднього скла; крихкість при низьких температурах підвищує ризик | 3.2//2.5 мм загартованого мінімально; розглянути 3.2//3.2 мм у зонах з сильним градом |
| 0,6–1,51 ТП3Т | Прискорена деградація задньої плівки сіллю; корозія на клемовому ящику/рамі | Корозія торцевого ущільнення; корозія розподільної коробки; менший ризик пошкодження задньої плівки | Переважно подвійне скло; сертифікація IEC 61701 на стійкість до соляного туману є обов'язковою; фурнітура з нержавіючої сталі |
| 1,2–2,81 ТП3Т (2,0//2,0 мм); 0,8–2,01 ТП3Т (загартована проти граду) | Комбо "Сіль + град" | Град + сіль на краю ущільнювача | Закалене подвійне скло, стійке до граду, згідно з IEC 61701; корозійностійкі рами/корпуси |
| 3,0–7,51 ТП3Т (2,0//2,0 мм); 1,8–4,51 ТП3Т (градостійкий) | Град панує; сіль прискорює корозію після пошкодження | Розбиття заднього скла; потрапляння солі після пошкодження | 3.2//2.5мм загартований градом + IEC 61701; критично важливе міцне крайове ущільнення |
Для комерційних проєктів, де надійність і час безвідмовної роботи впливають на фінансовий прибуток, це не бажана функція. Це фундаментальний захід зі зниження ризиків.
Конструкція з подвійним склом також забезпечує високу двосторонність, завдяки якій технологія HJT є настільки ефективною. Оскільки задня поверхня є прозорою, ці модулі вловлюють відбите та розсіяне світло, яке в іншому випадку було б втрачене. За умови правильного монтажу — на білих покрівельних покриттях або наземних опорах із відбивними поверхнями — ви отримуєте додатковий вихід енергії в обсязі 5–151 ТП3Т практично без додаткових витрат.
Саме тому оптові двосторонні модулі HJT потужністю 700 Вт для комерційних проєктів все частіше вибирають розробники, які провели аналіз життєвого циклу. Початкова премія за вартістю багаторазово окупається завдяки високій продуктивності та зниженню ризиків.
Закон про зниження інфляції: Тягни та штовхай одночасно
Закон США про зниження інфляції є найамбіційнішою спробою будь-якої західної країни відновити вітчизняну екосистему виробництва чистої енергії. Стимули для вітчизняного контенту є суттєвими — достатньо суттєвими, щоб викликати хвилю оголошень про нові виробничі потужності по всьому ланцюжку створення сонячної енергії.
Але ось у чому напруженість: ці стимули працюють лише за наявності реальних внутрішніх потужностей для купівлі. А зараз їх немає – принаймні, не в тому масштабі, який потрібен для задоволення попиту.
Отже, у вас склалася така дивна ситуація, коли розробники хочуть скористатися стимулами IRA, але не можуть отримати достатньо кваліфікованого обладнання. Водночас та ж сама політика включає мита та обмеження, призначені для блокування дешевого імпорту, що ще більше погіршує дефіцит поставок.
Це створює динаміку “штовхання та тяжіння”, яка руйнує графіки проєктів. IRA притягує проєкти до внутрішнього контенту. Мита штовхають проти доступного імпортного обладнання. Результат? Нижчі обсяги розгортання в короткостроковій перспективі, вищі витрати та величезна невизначеність.
Вице-президент з розробки у великого комерційного девелопера сонячної енергії. ——
“Наразі у нас є три проекти, які перебувають у стані очікування, поки з’ясується, чи підпадатимуть необхідні нам модулі під пільги в рамках Закону про індустріальне відновлення (IRA), чи на них будуть накладені мита. Неможливо гарантувати фінансування цих угод, коли економічні передумови можуть змінитися за одну ніч”.”
Якщо ви дистриб'ютор або оптовик, який намагається обслуговувати цей ринок, ви, по суті, робите обґрунтовані припущення щодо напрямків політики і сподіваєтесь, що будете зайняли правильну позицію, коли все вляжеться.
Мета — сприяння стійкому, безпечному внутрішньому ланцюжку поставок — є стратегічно обґрунтованою. Виконання хаотичне. А наслідки вимірюються гігаватами затриманих або скасованих проєктів.
Критичні мінерали: вузьке місце
Ось де сонячна енергія перетинається зі зберіганням енергії таким чином, що створює геополітичні кошмари.
Сонце та зберігання енергії все частіше розгортаються разом, особливо для комерційних проектів, де управління платою за попит або арбітраж за часом використання мають економічний сенс. Але ланцюжок поставок акумуляторів домінує літій, а видобуток та переробка літію контролюється відносно невеликою кількістю гравців — багато з яких мають значну китайську власність або фінансування.
Правила США щодо іноземних компаній, що викликають занепокоєння (FEOC), покликані обмежити китайський вплив у ланцюжку поставок чистої енергії. На практиці вони створюють неможливий вибір для багатих на ресурси країн, таких як Австралія.
Австралійські літієві проєкти, що мають фінансові зв'язки з Китаєм, стикаються зі зростаючими труднощами в отриманні субсидій США. Це ставить австралійські гірничодобувні компанії в скрутне становище: або прийняти китайський капітал і втратити доступ до ринків США, або відмовитися від нього і боротися за фінансування розробки.
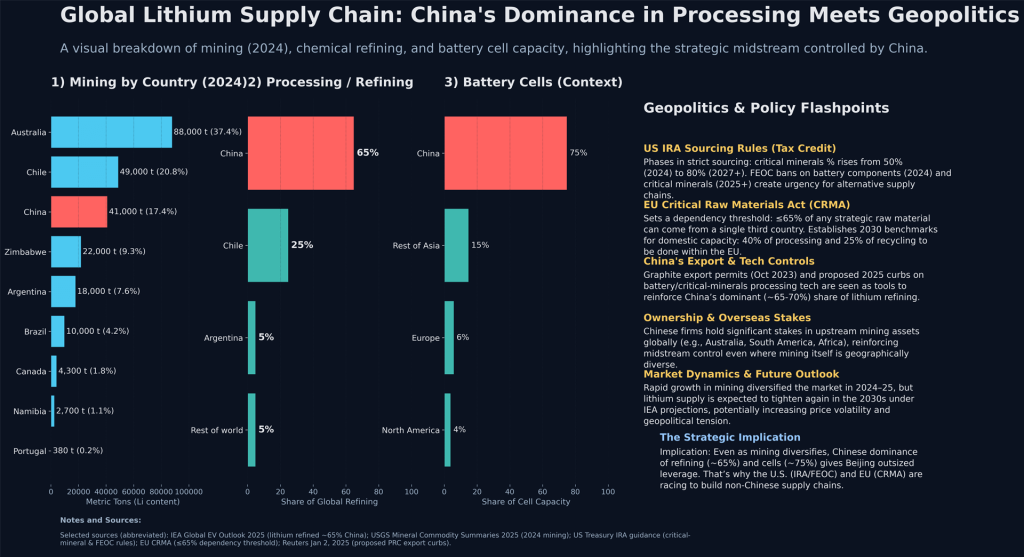
Це ефективно роз'єднує ланцюги поставок, створюючи паралельні, конкуруючі екосистеми на Заході і Сході. Для комерційних сонячних девелоперів, які намагаються поєднати проєкти зі зберіганням енергії, ця фрагментація означає вищі витрати, довші терміни виконання та більшу складність у пошуку обладнання.
Взаємозв'язок між сонячними модулями, батареями та критично важливими мінералами стає нерозривним. Політичні рішення в одній сфері каскадно впливають на весь ланцюг створення вартості. Прийняття рішень щодо закупівель без розуміння цих залежностей стає все більш ризикованим.
Що це насправді означає для Вашого бізнесу
Якщо ви шукаєте обладнання для комерційних сонячних проектів, підручник, який працював у 2023 році, більше не працює.
Ви не можете просто звернутися до постачальника, отримати комерційну пропозицію на найдешевші доступні модулі PERC і сподіватися, що все владнається. Змінних стало більше, а ставки вищі.
Ось що роблять розумні покупці прямо зараз:
Вони тестують свої ланцюжки постачання на стресостійкість. Хто ваші резервні постачальники? Якщо ваше основне джерело зіткнеться з митами або не зможе доставити протягом шести місяців, який ваш План Б? Якщо у вас немає хороших відповідей на ці запитання, ви вразливі.
Вони використовують моделі повної вартості життєвого циклу замість простого порівняння початкових цін на модулі. Збільшення ефективності, нижчі показники деградації та кращі показники продуктивності таких технологій, як двошарові модулі HJT, кардинально змінюють економіку при моделюванні протягом 25-30 років.
Вони будують стосунки з виробниками, які мають географічну диверсифікацію та технологічне лідерство. Постачальники, які можуть орієнтуватися в торговельних збоях та інвестують у технології наступного покоління, будуть існувати — і залишаться конкурентоспроможними — ще п’ять років.
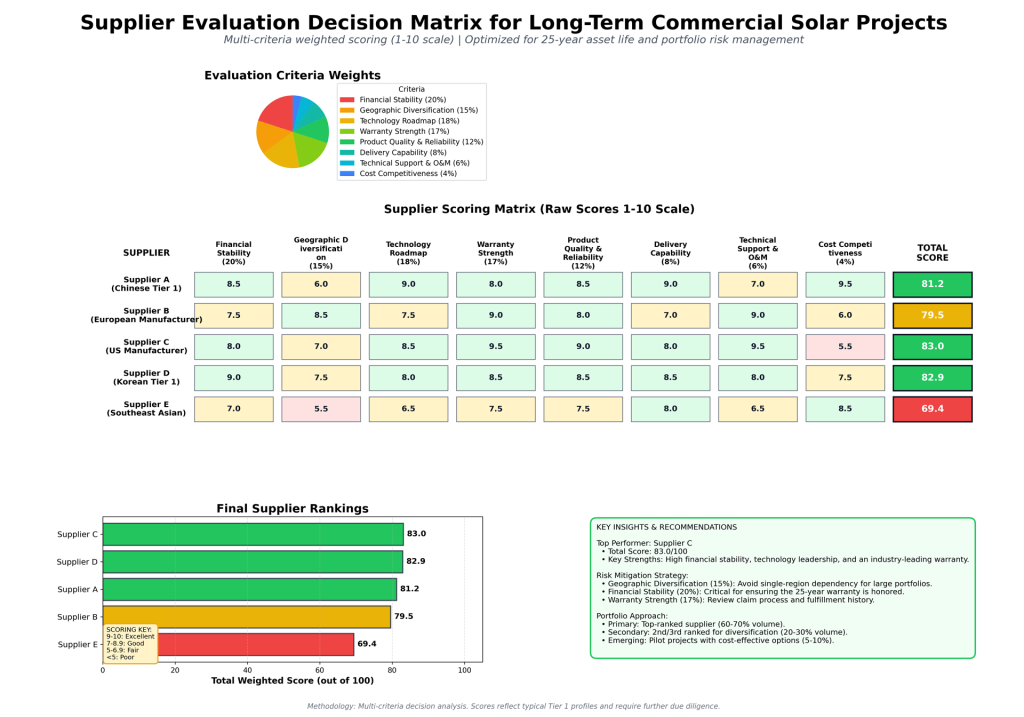
| РЕЗЮМЕ Рейтинг | ||
| Постачальник | Сукупна зважена оцінка | Нотатки |
| Постачальник C (американський виробник) | 83.05 | Преміальна якість та підтримка, кваліфіковано для IRA, але найвища вартість |
| Постачальник D (Корейський Tier 1) | 82.9 | Збалансований профіль, хороша фінансова підтримка, менший геополітичний ризик, ніж у Китаю |
| Постачальник А (китайський Tier 1) | 81.2 | Лідерство в технологіях та витратах, але географічна концентрація та геополітичний ризик |
| Постачальник Б (Європейський виробник) | 79.55 | Сильний у диверсифікації та підтримці, але коштовний преміум та обмеження потужності |
| Постачальник Е (Південно-Східна Азія) | 69.4 | Новий гравець, конкурентоспроможний за ціною, але з вищим профілем ризику щодо довгострокової підтримки |
| Детальні результати | ||
| Постачальник | Фінансова стабільність (сира) | Фінансова стабільність (зважена) |
| Постачальник C (американський виробник) | 8 | 16 |
| Постачальник D (Корейський Tier 1) | 9 | 18 |
| Постачальник А (китайський Tier 1) | 8.5 | 17 |
| Постачальник Б (Європейський виробник) | 7.5 | 15 |
| Постачальник Е (Південно-Східна Азія) | 7 | 14 |
| Географічна диверсифікація (Сира) | Географічна диверсифікація (зважена) | Дорожня карта технологій (Сира) |
| 7 | 10.5 | 8.5 |
| 7.5 | 11.25 | 8 |
| 6 | 9 | 9 |
| 8.5 | 12.75 | 7.5 |
| 5.5 | 8.25 | 6.5 |
| Дорожня карта технологій (зважена) | Сила гарантії (Сира) | Гарантійна міцність (зважена) |
| 15.3 | 9.5 | 16.15 |
| 14.4 | 8.5 | 14.45 |
| 16.2 | 8 | 13.6 |
| 13.5 | 9 | 15.3 |
| 11.7 | 7.5 | 12.75 |
| Якість та надійність продукції (сира) | Якість та Надійність Продукту (Зважено) | Можливості доставки (сирі) |
| 9 | 10.8 | 8 |
| 8.5 | 10.2 | 8.5 |
| 8.5 | 10.2 | 9 |
| 8 | 9.6 | 7 |
| 7.5 | 9 | 8 |
| Можливості доставки (зважені) | Технічна підтримка та експлуатація (сирі) | Технічна підтримка та Операції та Технічне Обслуговування (Зважені) |
| 6.4 | 9.5 | 5.7 |
| 6.8 | 8 | 4.8 |
| 7.2 | 7 | 4.2 |
| 5.6 | 9 | 5.4 |
| 6.4 | 6.5 | 3.9 |
| Цінова конкурентоспроможність (сирі дані) | Конкурентоспроможність за витратами (зважена) | Сукупна зважена оцінка |
| 5.5 | 2.2 | 83.05 |
| 7.5 | 3 | 82.9 |
| 9.5 | 3.8 | 81.2 |
| 6 | 2.4 | 79.55 |
| 8.5 | 3.4 | 69.4 |
| Визначення критеріїв | ||||
| Критерій | Вага (%) | Опис | Метод вимірювання | Обґрунтування важливості |
| Фінансова стабільність | 20 | Кредитний рейтинг, фінансова звітність, ризик банкрутства, здатність виконувати 25-річні гарантії | Кредитний рейтинг (від A+ до D), коефіцієнт боргу до власного капіталу, термін ведення бізнесу, стабільність доходу | Критично – постачальник повинен проіснувати понад 25 років, щоб надати гарантію та технічне обслуговування. |
| Географічна диверсифікація | 15 | Виробничі потужності, резервування ланцюгів постачання, вплив регіональних збоїв | Кількість виробничих потужностей, країни діяльності, домовленості з резервними постачальниками | Високий - зменшує геополітичні, ризики стихійних лих та торговельної політики |
| Технологічна дорожня карта | 18 | Інвестиції в R&D, підвищення ефективності, сумісність з майбутніми оновленнями | Річні витрати на НДДКР у розмірі 1–3 трлн, динаміка ефективності, зобов’язання щодо зворотної сумісності | Висока — забезпечує конкурентну продуктивність протягом 25-річного терміну служби активу |
| Гарантія міцності | 17 | Гарантія вихідної потужності модуля, гарантія якості виготовлення, процес розгляду гарантійних випадків | 25-річна лінійна гарантія, умови покриття, історія виконання вимог | Критичний - безпосередньо впливає на фінансові результати та профіль ризику проекту |
| Якість та надійність продукції | 12 | Рівні відмов у полі, сертифікати, результати сторонніх тестів (PVEL, DNV) | Рейтинг scorecard PVEL, сертифікації IEC, показники дефектності в польових умовах | Висока – впливає на витрати на експлуатацію та технічне обслуговування та гарантії виробництва енергії |
| Здатність до доставки | 8 | Терміни виконання, показники своєчасної доставки, логістична мережа, управління запасами | Середній термін виконання замовлення (тижнів), своєчасність поставок % (за останні 12 місяців), завантаження виробничих потужностей | Середні - впливають на графік проєкту та вимоги до закриття фінансування |
| Технічна підтримка та експлуатація | 6 | Підтримка після встановлення, моніторинг систем, наявність запасних частин | Час реагування служби підтримки, якість платформи моніторингу, терміни постачання запасних частин | Середнє - впливає на довгострокову операційну ефективність |
| Конкурентоспроможність за витратами | 4 | Ціни на модуль $/W у порівнянні з ринковими, знижки за обсяг, умови оплати | Ціна проти ринкової середньої, гнучкість умов оплати, загальна вартість володіння | Нижчий пріоритет – ціна є базовою умовою; диференціація залежить від факторів цінності/ризику |
| Сирі бали | ||
| Постачальник | Фінансова стабільність | Географічна диверсифікація |
| Постачальник А (китайський Tier 1) | 8.5 | 6 |
| Постачальник Б (Європейський виробник) | 7.5 | 8.5 |
| Постачальник C (американський виробник) | 8 | 7 |
| Постачальник D (Корейський Tier 1) | 9 | 7.5 |
| Постачальник Е (Південно-Східна Азія) | 7 | 5.5 |
| Технологічна дорожня карта | Гарантія міцності | Якість та надійність продукції |
| 9 | 8 | 8.5 |
| 7.5 | 9 | 8 |
| 8.5 | 9.5 | 9 |
| 8 | 8.5 | 8.5 |
| 6.5 | 7.5 | 7.5 |
| Здатність до доставки | Технічна підтримка та експлуатація | Конкурентоспроможність за витратами |
| 9 | 7 | 9.5 |
| 7 | 9 | 6 |
| 8 | 9.5 | 5.5 |
| 8.5 | 8 | 7.5 |
| 8 | 6.5 | 8.5 |
І вони доносять ці складнощі до своїх клієнтів. Комерційні покупці стають все більш витонченими. Вони розуміють, що найнижча ціна не завжди означає найкращу цінність. Вони хочуть партнерів, які можуть пояснити компроміси, моделювати сценарії та допомагати їм приймати рішення, які оптимізують довгострокову ефективність, а не лише початкову економію.
Формат 700 Вт: Чому розмір має значення
Давайте поговоримо конкретно про формат модуля 700 Вт, тому що це не довільний маркетинговий хід.
Галузь роками рухалася в бік більших модулів з вищою потужністю. Це не питання престижу; це питання економіки. Більші модулі означають меншу кількість одиниць для встановлення, що призводить до нижчих витрат на решту системи — менше кріпильного обладнання, менше електричних з'єднань, швидший час монтажу.
Для комерційних проєктів, що вимірюються в мегаватах, ця економія швидко накопичується. Проєкт потужністю 5 МВт, що використовує модулі по 700 Вт, потребує приблизно 7100 одиниць. Той самий проєкт, що використовує модулі по 500 Вт, потребує 10 000 одиниць. Це на 2900 менше монтажних точок, на 2900 менше електричних з'єднань і значна економія на робочій силі та матеріалах.
Ось детальний розбивка витрат, яка показує економію BOS на встановлений ват для різних класів потужності модулів (500 Вт, 600 Вт, 700 Вт), із використанням результатів пошуку та аналізу галузі:
Розбивка витрат системи (BOS) за класом потужності модуля
Ключовий принцип: Модулі з вищою потужністю зменшують загальну кількість необхідних модулів, безпосередньо знижуючи кількість компонентів BOS та витрати праці, що знижує вартість за ват.
Розбивка компонентів BOS (на встановлений ват)
| Компонент BOS | Модульні системи 500 Вт | 600W Модульні системи | 700-ватні модульні системи | Примітки та джерела |
|---|---|---|---|---|
| Стелажі/Конструкційні | $0.115/W | $0.105/Вт | $0.095/W | Менше модулів = менше точок кріплення; дослідження компанії Trina показує, що при більшій потужності вартість конструкції може знизитися на 121 TP3T |
| Електрика (електропроводка/роз'єми постійного струму) | $0.095/W | $0.080/Вт | $0.068/W | Вища потужність зменшує кількість стрінгів та довжину кабелів; 600 Вт зменшує елементи змінного струму порівняно з 500 Вт |
| Комбіновані бокси та роз'єднувачі | $0,025/Вт | $0.020/W | $0.015/W | Менше рядків = менше комбінаторів |
| Електропроводка та труби для електропроводки | $0.045/Вт | $0.041/W | $0.037/W | Відносно послідовний, але масштабується відповідно до складності системи |
| Інвертор BOS | $0.032/W | $0.032/W | $0.032/W | Вартість інвертора за ват залишається незмінною; використовується те ж обладнання |
| Монтажні роботи | $0.038/W | $0.032/W | $0.028/W | Менше панелей = швидший монтаж; скорочення трудомісткості на ~15–20 % для моделей потужністю 700 Вт порівняно з 500 Вт |
| Електромонтажні роботи та приєднання | $0.022/W | $0.018/W | $0.015/W | Менше з'єднань для підключення та тестування |
| Дозвіл та інспекція | $0.012/W | $0.012/W | $0.012/W | Фіксована вартість проєкту, але амортизована на меншу кількість ват для систем вищої потужності |
| Різне (фурнітура, кріплення) | $0.016/W | $0.013/W | $0.010/W | Пропорційно кількості модулів |
| ЗАГАЛОМ BOS на Ват | $0,400 Вт | $0.353/W | 0,312/Вт | Економія: 12% (600 Вт) та 22% (700 Вт) порівняно з 500 Вт |
Системний аналіз витрат (Типова комерційна покрівельна установка)
Якщо припустити, що 250 кВт система (тест з дослідження Trina/DNV):
| Метрика | Модулі 500 Вт (500 одиниць) | 600 Вт Модулі (417 шт.) | 700 Вт Модулі (357 одиниць) | Диференціал |
|---|---|---|---|---|
| Загальна кількість модулів | 500 | 417 | 357 | 86 менше (600 Вт) / 143 менше (700 Вт) |
| Загальна вартість BOS (обладнання) | $100,000 | $88,250 | $78,000 | $: економія 11 750 (600 Вт) / $: економія 22 000 (700 Вт) |
| Загальна вартість BOS за ват | $0.400 | $0.353 | $0.312 | - |
| Вартість стелажів | $28,750 | $26,250 | $23,750 | Економія $2,500 (600 Вт) / $5,000 (700 Вт) |
| Вартість електричних компонентів | $29,750 | $25,250 | $21,250 | Економія $4,500 (600 Вт) / Економія $8,500 (700 Вт) |
| Вартість роботи (монтаж) | $15,000 | $12,800 | $11,200 | $: економія 2 200 (600 Вт) / $: економія 3 800 (700 Вт) |
| Загальна вартість встановлення (BOS + робота) | $115,000 | $101,050 | $89,200 | Економія $13 950 (600 Вт) / Економія $25 800 (700 Вт) |
| Вартість встановлення за ват | $0.460 | $0.404 | $0.357 | Зниження на 121 TP3T (600 Вт) / Зниження на 22,41 TP3T (700 Вт) |
Детальна економія компонентів BOS
600 Вт проти 500 Вт модулів (на систему 250 кВт):
| Компонент | 500 Вт вартість | 600 Вт вартість | Заощадження | Водій |
|---|---|---|---|---|
| Монтажні рейки (алюмінієві) | $8,500 | $7,625 | $875 | 17% — менше модулів, пропорційне зменшення кількості матеріалу |
| Затискачі та кріплення | $4,200 | $3,536 | $664 | Менше точок кріплення |
| Кабелі постійного струму (на стрінг) | $6,800 | $5,440 | $1,360 | 20% — менше струн (для моделі 500 Вт потрібно ~50 струн; для моделі 600 Вт — ~42) |
| Роз'єми та автомати | $5,300 | $4,240 | $1,060 | Менше точок з'єднання |
| Комбіновані коробки | $3,100 | $2,480 | $620 | Потрібно менше комбінованих банків |
| Відключення та запобіжники | $1,950 | $1,560 | $390 | Менше розгалужень ланцюга |
| Проміжне скорочення обладнання | $29,750 | $25,241 | 1 444 4509 (зменшення на 15,21) | - |
700 Вт проти 500 Вт модулів (на систему 250 кВт):
| Компонент | 500 Вт вартість | 700W Вартість | Заощадження | Водій |
|---|---|---|---|---|
| Монтажні рейки (алюмінієві) | $8,500 | $7,125 | $1,375 | 29% на кілька модулів менше |
| Затискачі та кріплення | $4,200 | $2,975 | $1,225 | Менше точок кріплення |
| Кабелі постійного струму (на стрінг) | $6,800 | $4,760 | $2,040 | 30% — менше струн (500 Вт ~50; 700 Вт ~35) |
| Роз'єми та автомати | $5,300 | $3,710 | $1,590 | Менше точок з'єднання |
| Комбіновані коробки | $3,100 | $2,170 | $930 | Один великий комбайнер проти кількох маленьких |
| Відключення та запобіжники | $1,950 | $1,365 | $585 | Менше розгалужень ланцюга |
| Проміжне скорочення обладнання | $29,750 | $22,105 | 1 477 645 (зниження на 25,71 %) | - |
Ключові чинники економії BOS (вища потужність = менша кількість модулів)
Приклад зменшення рядка (система на 250 кВт, припускаючи, що трекер MPPT дозволяє 12-16 модулів/рядок):
- модулі 500 Вт: Потрібно 500 модулів → ~42 стрінгів → 42 автомати, 42 постійні кабельні лінії, кілька комбінаторів
- 600-ватні модулі: Потрібно 417 модулів → ~26 ланцюгів → 26 розгалужувачів, 26 кабельних трас постійного струму, менше об'єднувачів ✓ На 38% менше ланцюгів
- 700-ватні модулі: Потрібно 357 модулів → ~22 ланцюги → 22 відгалужувачі, 22 кабельні траси постійного струму, один комбайнер ✓ На 48% менше ланцюгів
Результат: Менше модулів → менше рядків → експоненційне скорочення електричних компонентів та проводки.
Економія на роботах з монтажу
Зменшення витрат на оплату праці масштабується зі збільшенням кількості та складності модулів:
| Трудове завдання | 500 Вт (500 модулів) | 600 Вт (417 модулів) | 700 Вт (357 модулів) | Скорочення |
|---|---|---|---|---|
| Вивантаження та підготовка модулів | 8 годин | 6,7 години | 5,7 години | приблизно на 291 TP3T швидше |
| Монтаж/встановлення | 12 годин | 9,6 години | 8,4 години | приблизно на 301 TP3T швидше |
| Електричні роз'єми (MC4, DC) | 10 годин | 7 годин | 5 годин | 50% — швидше (менше зв'язків) |
| Тестування та введення в експлуатацію | 4 години | 3,5 години | 3,2 год | приблизно на 201 TP3T швидше |
| Загальна кількість людино-годин | 34 години | 26,8 години | 22,3 години | ~35% годин менше для 700 Вт |
| Витрати на оплату праці @ $60/год | $2,040 | $1,608 | $1,338 | Економія при використанні $432 (600 Вт) / Економія при використанні $702 (700 Вт) |
Джерело: галузеві трудові нормативи; масштабування відображає пропорційне зменшення кількості модулів та складності з'єднань.
Вартість за Ват Порівняння (Включаючи Вартість Модуля + BOS)
За припущенням типових витрат на модулі у 2025 році:
| Товар | Модуль 500 Вт | 600 Вт модуль | Модуль 700 Вт |
|---|---|---|---|
| Вартість модуля (оптом FOB Китай) | $0.168/W | $0.153/W | $0.146/W |
| Вартість одиниці модуля | $84 | $91.80 | $102.20 |
| Вартість BOS за ват | $0,400 Вт | $0.353/W | $0.312/W |
| Загальне обладнання на ват | $0.568/W | $0.506/W | $0.458/W |
| Витрати на оплату праці та непрямі витрати на ват | $0.092/W | $0.072/W | $0.063/W |
| Повністю встановлено на ват | $0.660/Вт | $0.578/W | $0.521/W |
| Економія на ват проти 500 Вт | - | 12.41 Зниження TP3T | 21.11 Зниження TP3T |
Реальне тестування (Дослідження DNV/Trina)
З дослідження Trina Solar Vertex S+ 500W+ щодо проєкту на даху потужністю 250 кВт у Мілані:
- модулі 500 Вт+: Вартість конструкції $29 936
- Модулі 490 Вт (довідка): Вартість конструкції $30 663
- Модулі 450 Вт (довідкові): Вартість конструкції $33 936
- Скорочення500 Вт+ проти 450 Вт = 12.011 Економія витрат завдяки структурі TP3T
- Зменшення BOS: До 2,271 ТП3Т
- Зниження LCOE: До 4,241 ТП3Т
Екстраполюючи до 600 Вт / 700 Вт (пропорційне масштабування):
- 600 Вт проти 500 Вт: очікувана економія за методом BOS для структури ~14-15%
- 700 Вт проти 500 Вт: очікувана економія за структурою BOS ~22–241 TP3T
Практичний висновок Таблиця (Комерційна система потужністю 250 кВт)
| Метрика | 500W | 600 Вт | 700W | Найкраще для |
|---|---|---|---|---|
| Загальна вартість BOS | $100,000 | $88,250 | $78,000 | 700 Вт: $22K — енергозберігаюча модель |
| Вартість за ват (тільки BOS) | $0.400 | $0.353 | $0.312 | 700 Вт: на 221 TP3T дешевше |
| Час встановлення | 34 людино-години | 26.8 год | 22.3 години | 700 Вт: на 351 ТП3Т швидше |
| Кількість модулів | 500 | 417 | 357 | 700 Вт: на 143 менше модулів |
| Підрахунок рядків | ~42 | ~26 | ~22 | 700 Вт: на 481 TP3T менше струн |
| Матеріал для стелажів (фунти) | ~5,800 | ~4,900 | ~4,250 | 700 Вт: 271 ТП3Т без алюмінію |
| кабелі постійного струму | 42 | 26 | 22 | 700 Вт: редукція 48% |
| Повністю встановлений $/W | $0.660 | $0.578 | $0.521 | 700 Вт: на 211 TP3T дешевше |
| Перевага окупності | Базовий рівень | +2,51 TP3T ROI | +4,21 TP3T рентабельність інвестицій | 700Вт: Найкраща LCOE |
Обмеження та застереження
- Сумісність інвертора: Інвертори повинні витримувати вищу напругу постійного струму від вищих рядків (пом'якшується сучасною технологією MPPT)
- Навантаження на дах: Модулі потужністю 700 Вт важать приблизно на 181 кг більше, ніж модулі потужністю 500 Вт (для старих дахів необхідна перевірка конструкції)
- Монтажне обладнанняМенша кількість, але важчі модулі можуть потребувати інших процедур підйому
- Ланцюг постачання: модулі потужністю 600 Вт/700 Вт мають коротші терміни постачання, ніж на початок 2024 року; доступність нормалізувалася станом на 2025 рік
- Регіональні ставки заробітної плати: Шкала економії з урахуванням місцевих погодинних ставок (у регіонах із ставкою $30/год використовується менший модуль %, у регіонах із ставкою $80/год — більший модуль %)
Як використовувати це для ваших проєктів
- Для систем потужністю 100–250 кВт: Модулі потужністю 600 Вт забезпечують оптимальний баланс (економія на BOS завдяки технології 15%, перевірена надійність, широка доступність)
- Для систем від 250+ кВт: Рекомендується потужність 700 Вт і більше (економія за показником 22% BOS; еквівалентно зниженню LCOE на 1–2%)
- Для дахів, які модернізуються/мають обмеження щодо модернізації: 500 Вт допустимо, якщо існують обмеження навантаження на дах або напруги на ланцюзі
- Для промислових сонячних електростанцій, що встановлюються на землі: 700 Вт+ — обов’язково (30%+ економія за рахунок скорочення BOS при масштабуванні)
Але існує стеля практичного розміру. Модулі, які є занадто великими, стають складними для монтажних бригад, створюють логістичні проблеми та можуть не підходити до стандартних систем кріплення. Формат 700 Вт потрапляє в ідеальну точку: достатньо великий, щоб максимізувати економію коштів, і достатньо малий, щоб залишатися практичним для комерційних установок як на даху, так і на землі.
Коли ви поєднуєте цей форм-фактор із технологією HJT та подвійною скляною конструкцією, ви отримуєте максимальну щільність потужності, чудові характеристики продуктивності та перевірену довготривалу надійність в упаковці, оптимізованій для розгортання в комерційних масштабах.
Саме тому оптові двосторонні модулі HJT потужністю 700 Вт для комерційних проєктів стають улюбленою специфікацією для розробників, які відмовилися від простих стратегій закупівлі за ціною за Ват.
Що відбувається, коли музика стихає
Сонячна промисловість зараз переживає хвилю суперечностей. Рекордно низькі ціни зустрічаються з невизначеністю в ланцюжках поставок. Масові виробничі потужності зустрічаються з торговими бар'єрами. Швидкий технологічний прогрес зустрічається з консолідацією ринку.
Щось має змінитися.
Моя ставка — і, гадаю, ринок це вже показує — полягає в тому, що ми переходимо від епохи оптимізації витрат до епохи оптимізації цінності. Десятиліття безжальної цінової конкуренції закінчується. Наступне десятиліття визначатиметься диференціацією продуктивності, стійкістю ланцюгів постачання та загальною вартістю володіння.
Виробники, які виживуть і досягнуть успіху, будуть тими, хто зможе запропонувати передові технології, орієнтуватися в геополітичній складності та підтримувати фінансову стабільність у період ринкової волатильності. Покупці, які виграють, будуть тими, хто розуміє, що закупівлі є стратегічними, а не транзакційними.
Дешеві PERC-модулі, що заполонили сьогоднішній ринок, знаменують кінець цілої ери. Вони чудово підходять для проєктів, які можна швидко завершити і які не вимагають довгострокових відносин із постачальниками. Але для стратегічних комерційних розгортань із 30-річним терміном експлуатації та складними фінансовими структурами вони дедалі частіше стають неправильним вибором.
Технологія HJT, двоскляна конструкція та партнерство з постачальниками, що мають глобальне охоплення та технологічне лідерство — ось куди прямує ринок. Єдине питання: чи ви будете одним з перших, хто прийме цю трансформацію, чи будете поспішати наздогнати пізніше.
Нез'ясовані питання
Я був би нечесним, якби не визнав, що залишається величезна невизначеність.
Чи справді США запровадять обговорювані агресивні тарифи, чи розум візьме гору? Як швидко зростуть внутрішні виробничі потужності? Чи будуть правила FEOC змінені для забезпечення більшої гнучкості? Наскільки швидко перовськітові тандеми перейдуть від лабораторного до комерційного виробництва?
Ніхто не знає. Кожен, хто стверджує, що знає, щось продає.
Те, що ми знаємо, це: сонячна промисловість переживає фундаментальну реструктуризацію. Простий, глобалізований ланцюжок поставок, який знижував витрати протягом десятиліття, фрагментується. Технології розвиваються швидше, ніж ринкова інфраструктура може їх поглинути. Політика пишеться в режимі реального часу, часто суперечачи сама собі.
Для комерційних покупців, дистриб'юторів та розробників проєктів це середовище потребує іншого підходу. Вам потрібно бути більш стратегічними, більш диверсифікованими та більш обізнаними, ніж будь-коли раніше.
Компанії, які розглядають закупівлі як просте придбання товарів, зазнають втрат. Компанії, які розглядають їх як стратегічне управління ризиками та оптимізацію вартості, знайдуть можливості, які інші не помітять.
Це реальність сонячної енергетики у 2025 році. Це не просто. Це не стабільно. Але для тих, хто знає, як орієнтуватися в ній, вона сповнена можливостей.
Питання в тому, чи готові ви до того, що буде далі.