


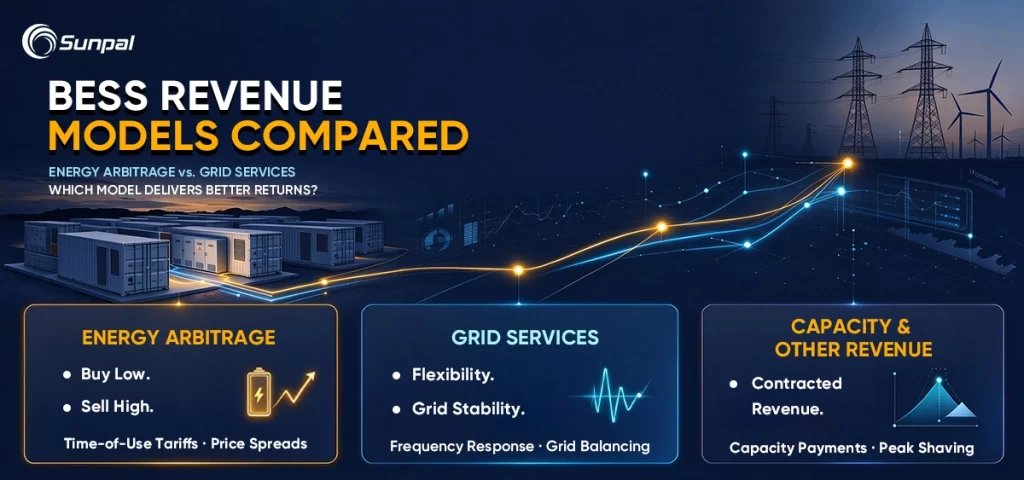
Batteriespeicher-Energiespeichersysteme have moved from experimental pilots to essential infrastructure for modern power systems. Yet one question keeps surfacing in project reviews, investor calls, and industry forums: “Is the battery actually worth it?” Behind that question sit concerns about financials, payback periods, and long-term bankability. Two revenue philosophies dominate the debate—energy arbitrage and grid services—while real-world projects almost always stack multiple streams to deliver solid returns.
This article examines both models in depth, maps the broader BESS revenue stack, and shows how developers and investors can build bankable projects that improve solar plus storage ROI. The goal is practical clarity: neither pure arbitrage nor pure grid services is universally superior. The winning approach depends on market rules, asset duration, technology choices, and the ability to combine value streams with confidence.
Why the “Is the Battery Worth It?” Question Still Haunts Projects
Developers hear the skepticism regularly. Upfront capital costs remain high. Battery degradation creates modeling uncertainty. Policy and market rules can shift. Pure merchant revenue feels risky to lenders. These concerns are legitimate, yet they often overlook how sophisticated BESS financial models and revenue stacking have matured.
Lenders and equity investors focus on a handful of metrics: debt-service coverage ratios under stress scenarios, the share of contracted versus merchant revenue, technology risk (cycle life, thermal performance, power conversion system reliability), and the credibility of the energy management system (EMS). A transparent revenue stack that mixes predictable capacity or ancillary payments with upside energy market participation usually satisfies these tests better than any single stream.
Solar-plus-storage configurations further strengthen the case. Shared interconnection, reduced curtailment, and complementary operating profiles lift overall project economics. When developers can demonstrate that the storage asset earns revenue even on low-solar days through grid services or demand response, the combined solar plus storage ROI becomes far more attractive.
Typical Lender Checklist for
BESS Bankability
Illustrative data based on common project-finance practices for utility-scale and large commercial battery energy storage systems.
Key Bankability Thresholds
Revenue structure, operating performance and debt service metrics
Technology & Risk Items
Technical performance, safety and risk management factors
Commercial & Sponsor Factors
Business structure, financing terms and project resilience
Disclaimer: Figures are illustrative reference ranges, not universal lending requirements. Actual thresholds depend on jurisdiction, market design, project structure, revenue contracts, lender policy and independent technical and financial due diligence. Applicable standards and certification requirements should be confirmed for each project.
Mapping the Full BESS Revenue Stack Beyond Backup Power
Backup power remains valuable, especially for commercial and industrial sites and critical facilities, but it is rarely the primary driver of utility-scale or large commercial returns. Today's bankable projects draw from a richer set of streams:
- Energy arbitrage (buying low, selling high in wholesale markets)
- Grid services (frequency regulation, reserves, capacity, voltage support)
- Peak shaving and demand-charge management
- Renewable smoothing and firming
- Data-center demand response and behind-the-meter flexibility
- Capacity market participation and resource adequacy payments
As illustrated in detailed analyses of revenue stacking for grid-scale batteries, most successful assets combine two to four of these. Pure single-stream projects exist, but they usually carry higher risk premiums or shorter contract tenors. The art of BESS project development lies in designing an operating strategy and commercial structure that captures multiple streams without excessive operational conflict.
Typical Hybrid BESS Revenue Mix
Illustrative annual revenue shares across four revenue streams and four markets.
Revenue Mix by Market
Illustrative market-specific revenue distribution.
CAISO
ERCOT
PJM
European Markets
Energy Arbitrage: Capturing Price Volatility for Higher Upside
Energy arbitrage is conceptually simple. The battery charges when wholesale prices are low (often overnight or during high renewable output) and discharges when prices spike. In markets with strong diurnal or weather-driven volatility, the spreads can be substantial.
Key performance drivers include round-trip efficiency, forecasting accuracy, EMS optimization, cycle life, and duration. A two-hour system captures short, sharp peaks effectively; a four-hour system can ride longer evening ramps or multi-hour price events. As more storage enters a market, the very act of arbitraging can compress spreads—an effect already visible in some high-penetration regions. This “cannibalization” risk is real and must be modeled conservatively in any BESS financial model.
Co-located solar-plus-storage projects enjoy structural advantages. The battery can absorb excess midday solar that would otherwise be curtailed and release it during evening peaks, effectively turning intermittent generation into a more dispatchable product. This improves both the solar plant's effective capacity factor and the storage asset's utilization.
Arbitrage-heavy projects often show higher modeled IRRs in volatile markets, yet they score lower on pure bankability because revenue is largely merchant. Lenders typically require larger equity cushions, stronger sponsor balance sheets, or partial hedges to compensate.
BESS Revenue Optimization & Dispatch
Illustrative electricity price spreads, discharge duration comparison and a 24-hour battery operating cycle.
1. Historical Day-Ahead Price Spreads
Monthly average peak-to-off-peak spread · Jan 2023–Dec 2025 · USD/MWh
Hover over any point to view its month and exact spread. On mobile, swipe horizontally across the chart.
2. Two-Hour vs. Four-Hour Discharge Profiles
Typical evening peak index and discharge output as a percentage of rated power.
Hover over each data point to compare peak index and discharge output for each hour. The profiles are illustrative operating schedules, not a universal dispatch rule.
3. 24-Hour BESS Charge/Discharge Cycle
Illustrative 100 MW system · Starting state of charge (SOC): 50%
Press Play Cycle to step through the six operating periods. Negative power indicates charging; positive power indicates discharging. SOC changes are illustrative and are not a precise energy-balance simulation.
Grid Services: Building Predictable Cash Flows That Lenders Prefer
Grid services encompass a family of products that help system operators maintain reliability and power quality. Frequency regulation rewards fast, precise response. Operating reserves and capacity markets pay for availability. Emerging products cover voltage support, black-start capability, and inertia-like services from grid-forming inverters.
Compensation structures vary—pay-for-performance, capacity payments, availability payments, or hybrid mechanisms—but many offer multi-year visibility or clearing prices that are more stable than pure energy markets. This predictability improves debt-service coverage and lowers the cost of capital, directly enhancing battery storage bankability.
Performance requirements are stringent. The battery and power conversion system must respond in seconds or milliseconds, maintain tight state-of-charge windows, and avoid excessive degradation. An advanced EMS that can co-optimize across multiple products while respecting warranty constraints is essential. Thermal management also becomes critical because high-power, frequent cycling generates heat that accelerates aging if not controlled.
Grid-services-dominant stacks generally produce more conservative but more financeable BESS ROI profiles. In markets with robust ancillary service or capacity mechanisms, these projects often clear investment hurdles with lower merchant exposure.
Comparison Table of Major Grid-Service Products
Compare response speed, sustainment requirements, compensation structures, and key battery energy storage system (BESS) considerations across major grid-service products.
| Grid-Service Product | Typical Response Time | Duration / Sustainment Needs | Primary Compensation Styles | Key Notes for BESS |
|---|---|---|---|---|
| Core service Frequenzregelung RegA / RegD, FCR, aFRR | 1–10 seconds Fast response; continuous signal following | Continuous operation or energy-neutral cycling over periods of roughly 15–60 minutes, depending on the product. | Pay-for-performance (mileage × accuracy); capacity reservation payment; sometimes energy settlement. | Well suited to batteries because of high power and rapid response. Frequent cycling makes accurate state-of-charge (SOC) management important. |
| Core service Spinning / Synchronous Reserves Contingency reserves | 10 seconds–10 minutes Product-dependent activation | Typically 30–60 minutes; some products require 30–120 minutes of sustainment. | Capacity payment ($/MW-day or $/MW-h), plus energy payment if deployed. | Batteries can provide fast reserve response without a conventional generator continuously operating at part load, subject to market rules and availability requirements. |
| Additional service Non-Spinning / Supplemental Reserves | 10–30 minutes Slower activation window | Typically 30–120 minutes. | Capacity payment, plus energy payment if called. | Less demanding on response speed than regulation. Longer-duration BESS can provide reserve energy while preserving capacity for other services. |
| Core service Capacity / Resource Adequacy PJM Capacity, CAISO RA, European capacity mechanisms | N/A Must be available when called | Often 2–4+ hours; four-hour capability is important in many U.S. market applications. | Fixed or auction-cleared capacity payment, such as $/MW-year or $/MW-day. | Longer-duration systems may be better positioned for capacity obligations. Multi-year contracts can support revenue visibility, subject to qualification and performance rules. |
| Additional service Voltage / Reactive Power Support | Seconds–minutes Fast inverter-based control | Continuous or as needed, within inverter and grid-code capability. | Fixed capability payment or performance-based compensation, depending on market design. | Power conversion system (PCS) capability is central. Grid-forming functionality may offer additional value where specified by grid requirements. |
| Additional service Black-Start Service | Minuten System-restoration sequence | Several hours may be needed during restoration, depending on the system plan. | Fixed annual or capability payment; terms vary by operator and contract. | A specialized application requiring robust controls, auxiliary power, and verified restoration capability. Hybrid resources may need fuel-secure generation or other support. |
Note: Illustrative comparison of typical requirements in major U.S. and European markets. Actual response times, sustainment periods, qualification criteria, and payment mechanisms vary by ISO/RTO, TSO, and individual market product. Confirm applicable rules before using these values for project sizing or financial modelling.
How BESS Tracks a Frequency Regulation Signal
Illustrative 10-minute signal trace: battery power output closely follows the dispatch set-point, demonstrating the fast and accurate response that makes BESS suitable for frequency regulation.
Head-to-Head: Arbitrage, Grid Services, and the Hybrid Advantage
A direct comparison reveals clear trade-offs. Independent research evaluating the revenue potential of energy storage shows that hybrid stacks consistently outperform pure single-stream approaches.
Revenue predictability and bankability: Grid services usually win. Contracted or quasi-contracted payments support higher leverage and tighter DSCR requirements. Pure arbitrage scores lower unless paired with hedges or offtake agreements.
Upside potential: Arbitrage typically offers a higher ceiling in volatile markets, especially before saturation sets in. Hybrids capture both the floor and the upside.
Duration sensitivity: Two-hour systems often excel at fast grid services and short price spikes. Four-hour (and longer) systems capture more energy arbitrage value and meet many capacity product requirements. Choosing duration is therefore a core design decision that feeds directly into the BESS financial model. (For a deeper treatment of duration economics, see related guidance on 2-hour versus 4-hour sizing.)
Operational complexity: Grid services demand faster controls and stricter performance guarantees. Arbitrage relies more on accurate price forecasting and optimal bidding. Hybrids require sophisticated multi-market optimization software.
Market suitability: High-volatility energy-only markets favor arbitrage emphasis. Markets with strong capacity or ancillary mechanisms favor services. Most mature markets reward a balanced stack.
In practice, the highest-performing and most bankable projects combine streams. A common pattern is capacity or regulation payments providing a revenue floor, energy arbitrage supplying upside, and behind-the-meter or renewable-firming services adding further value—especially in solar-plus-storage configurations. When modeled with realistic degradation, efficiency, and market evolution assumptions, these hybrid stacks frequently deliver attractive risk-adjusted returns that answer the “is the battery worth it” question with a clear yes.
Which BESS Revenue Model Fits Your Market?
Compare revenue stability, upside potential, duration preference and financing considerations.
| Bewertungsfaktor | ● Energy Arbitrage Dominant | ● Grid Services Dominant | ● Hybrid Stack |
|---|---|---|---|
| Revenue Predictability | 2/5 |
3/5 |
4/5 |
| Upside Potential | 4/5 |
3/5 |
5/5 |
| Preferred Duration | 2–4+ hours | Short to medium duration | Market-dependent |
| Bankability Potential | Price-spread dependent | Contract and market-rule dependent | Diversified revenue sources |
| Main Risk | Spread compression | Service saturation / rule changes | Dispatch and revenue stacking complexity |
| Lender Preference | Strong price evidence required | Contracted revenue preferred | Clear stacking rules and downside case |
| Best-Fit Market | Volatile wholesale markets | Frequency and ancillary services markets | Multiple monetizable value streams |
Illustrative qualitative comparison only. Actual revenue mix and financing outcomes depend on market rules, asset configuration, contracts and project-specific assumptions.
How Revenue Stacking Can Improve BESS Bankability
100 MW / 400 MWh BESS · Illustrative IRR and DSCR progression by revenue layer
RA = resource adequacy; BTM = behind the meter; DR = demand response. The final row repeats the preceding scenario's 15.5% IRR and 1.55x DSCR, so it should not be interpreted as an additional uplift. Actual results depend on financing, dispatch constraints, market rules and revenue stacking feasibility.
Where Different BESS Revenue Models Lead
Indicative market tendencies across major energy storage markets
Market positioning is indicative rather than exclusive. Revenue opportunities vary by project location, market access, asset duration, interconnection, dispatch strategy and applicable rules.
The Hidden Drivers of Real-World ROI and Bankability
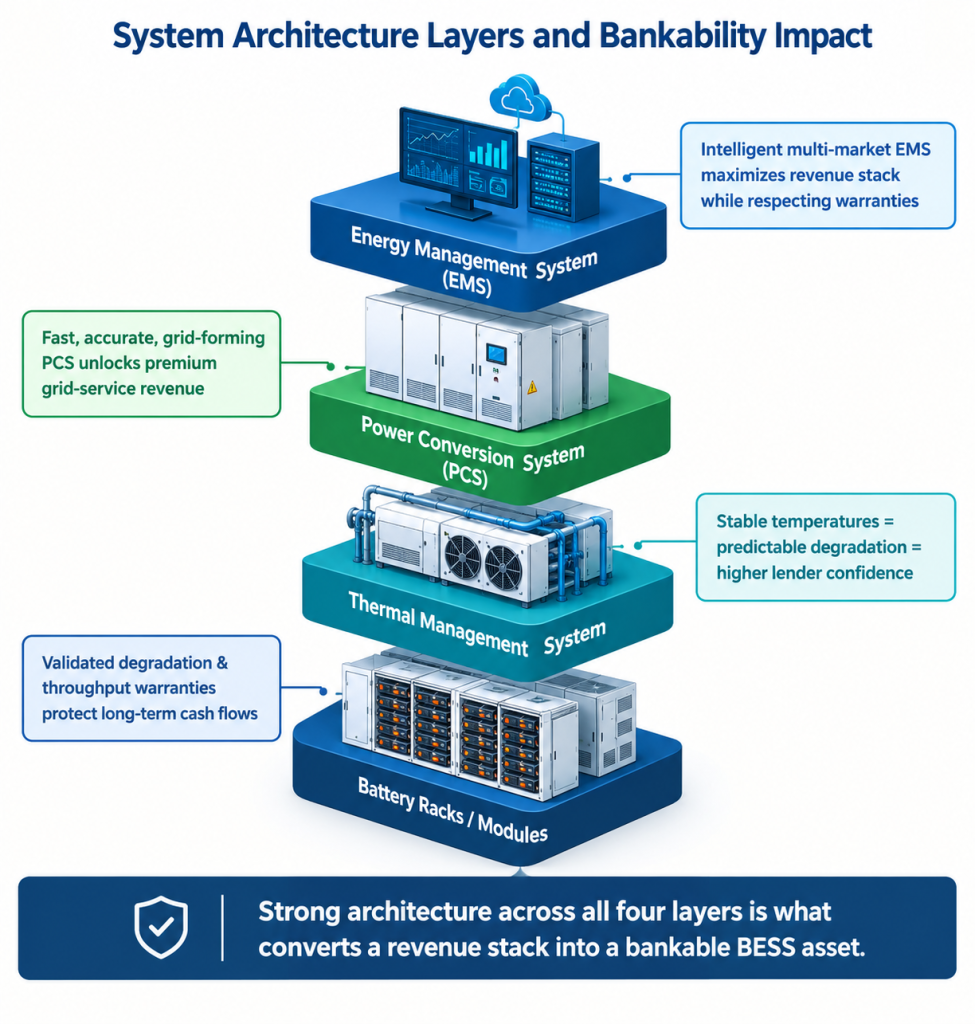
Revenue strategy alone does not guarantee success. Technology and architecture choices determine whether projected revenues materialize over a 15- or 20-year life.
The power conversion system (PCS) must deliver high efficiency, rapid response, and increasingly grid-forming capability. The energy management system must forecast, optimize, and bid across multiple markets while respecting battery warranties and thermal limits. Thermal management systems keep cells within optimal temperature ranges, directly influencing degradation rates and therefore lifetime energy throughput—the single largest variable in long-term BESS ROI.
These elements are not optional extras; they are foundational to bankability. Lenders scrutinize them because underperformance in any one area can erode the entire revenue stack. (For a full discussion of how PCS, EMS, and thermal design underpin long-term value, refer to the companion System Architecture resources.)
Financing structures further shape outcomes. Tolling agreements, capacity contracts, blended offtake arrangements, tax incentives, and specialized insurance products can convert a partially merchant project into a highly financeable one. Solar-plus-storage projects benefit from additional levers such as shared interconnection cost allocation and improved renewable energy credit or capacity accreditation in some jurisdictions.
A Practical Decision Framework for Developers and Investors
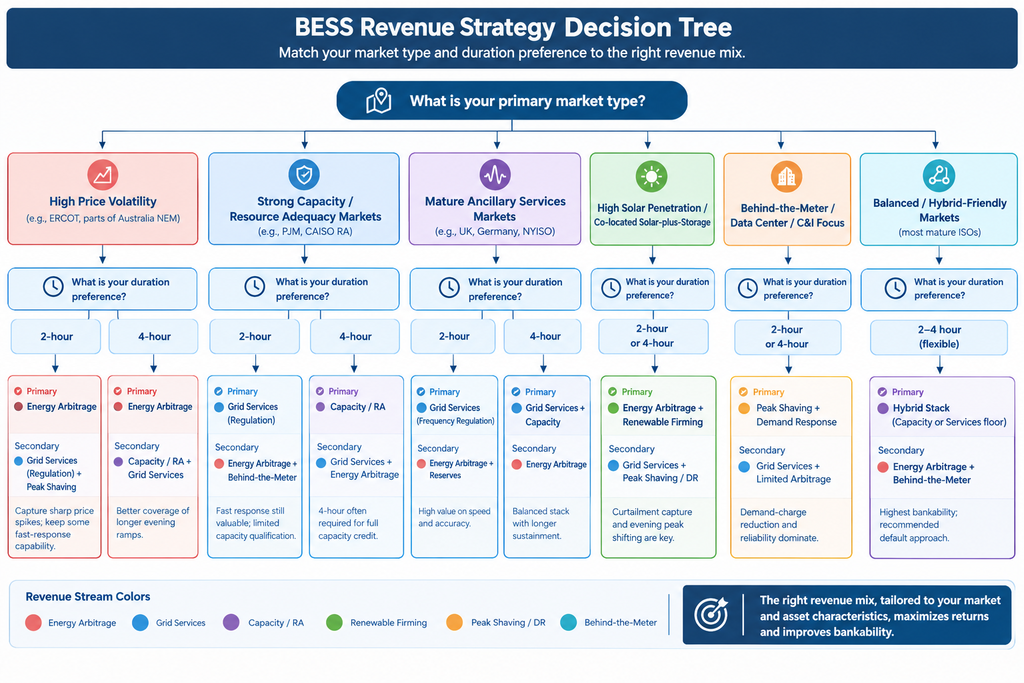
Selecting the right revenue model begins with five practical questions:
- What products does the target market actually procure, and how are they compensated?
- What duration and power rating best match those products and the available site constraints?
- What mix of contracted versus merchant revenue aligns with the sponsor's risk tolerance and the lenders' requirements?
- Are there co-location opportunities—solar, large commercial load, or data-center demand response—that unlock additional streams?
- What target IRR and minimum DSCR must the BESS financial model clear under base and downside cases?
Answering these questions systematically usually points toward a hybrid stack rather than a pure strategy. In high-volatility markets with limited capacity payments, lean toward arbitrage with selective grid-service participation. In markets with robust ancillary or capacity mechanisms, lean toward services while retaining energy-market optionality. Wherever solar resources exist, evaluate co-location carefully—the combined solar plus storage ROI frequently exceeds the sum of the standalone parts.
Emerging opportunities continue to expand the toolkit. Data-center demand response is growing rapidly as hyperscale loads seek flexibility. Multi-day storage and virtual power plant aggregation are beginning to open new value streams. Forward-looking developers already incorporate these possibilities into their modeling.
Conclusion: Stacking Value Is How Storage Wins
The debate between energy arbitrage and grid services is useful for clarifying trade-offs, but it is rarely an either-or choice in successful projects. The assets that consistently deliver strong BESS ROI and high battery storage bankability are those that deliberately stack complementary revenue streams, pair them with robust system architecture, and model the results with conservative yet realistic assumptions.
When developers can show lenders a credible path to contracted floors plus merchant upside, when they can demonstrate that PCS, EMS, and thermal management will protect lifetime throughput, and when they integrate storage with solar resources to capture additional synergies, the question “Is the battery worth it?” receives a confident affirmative answer.
The storage industry has moved past the proof-of-concept stage. The next wave of projects will be defined less by any single revenue model and more by the quality of the overall revenue stack and the engineering discipline that underpins it. Projects built on that foundation are already achieving attractive returns and securing financing at scale—and they will continue to do so as markets evolve.