


How quickly can a solar investment pay for itself—and is paying more for high-efficiency panels really worth it?
As solar technology advances, choosing the right panels is no longer simply about comparing upfront prices. High-efficiency modules are changing how buyers think about energy production, investment costs, and long-term returns.
This makes solar payback calculation a key starting point when evaluating whether a solar investment can deliver lasting financial value.
What Is Solar Payback Calculation?
The solar payback period is the estimated time required for a solar system to recover its net initial investment through energy savings and other financial benefits.
For a simple estimate:
Simple Solar Payback Period = Net System Cost ÷ Annual Net Solar Savings
For example, a system with a net cost of $18,000 and $2,000 in annual solar savings would have an estimated payback period of:
$18,000 ÷ $2,000 = 9 years
This provides a useful starting point for evaluating a solar investment. However, actual payback can vary depending on energy production, electricity rates, self-consumption, utility compensation, financing, operating costs, and system degradation.
What Factors Affect the Solar Payback Period?
A solar payback calculation should use realistic project data rather than relying only on a standard industry estimate.
Net System Cost
The initial investment includes equipment, installation, permitting, interconnection, and other project expenses, after applicable incentives or rebates.
A lower initial cost can shorten payback, but the lowest-cost system is not necessarily the most financially attractive over its lifetime.
Annual Energy Production
The amount of electricity generated directly affects potential solar energy savings.
Production depends on factors such as:
- Solar irradiance
- Module efficiency
- Roof or site orientation
- Tilt and shading
- Temperature
- Inverter performance
- System design
Electricity Rates and Self-Consumption
The financial value of solar generation depends on the electricity it offsets.
A property that consumes a significant amount of electricity while the solar system is producing may be able to capture more value through direct self-consumption.
Higher electricity rates can also increase the potential value of each kilowatt-hour generated.
Utility Compensation
Excess solar electricity may be compensated through net metering, net billing, feed-in tariffs, or other utility programs.
Because these policies vary by location, identical solar systems can have different payback periods in different markets.
Financing and Operating Costs
Loan interest, maintenance, inverter replacement, and other long-term costs can affect the actual financial return.
For a detailed analysis, these costs should be included rather than relying only on the simple payback formula.
Module Degradation
Solar panels gradually lose some production capacity over time.
A lifetime financial model should therefore account for expected degradation when estimating long-term solar energy savings.
How High-Efficiency Panels Increase Energy Production
Once the basic payback factors are understood, the next question is how high-efficiency panels can change the economics of a solar system.
The main advantage is straightforward:
Higher-efficiency panels can generate more electricity from the same available installation area.
This can be especially valuable when roof or land availability is limited.
More Power From the Same Footprint
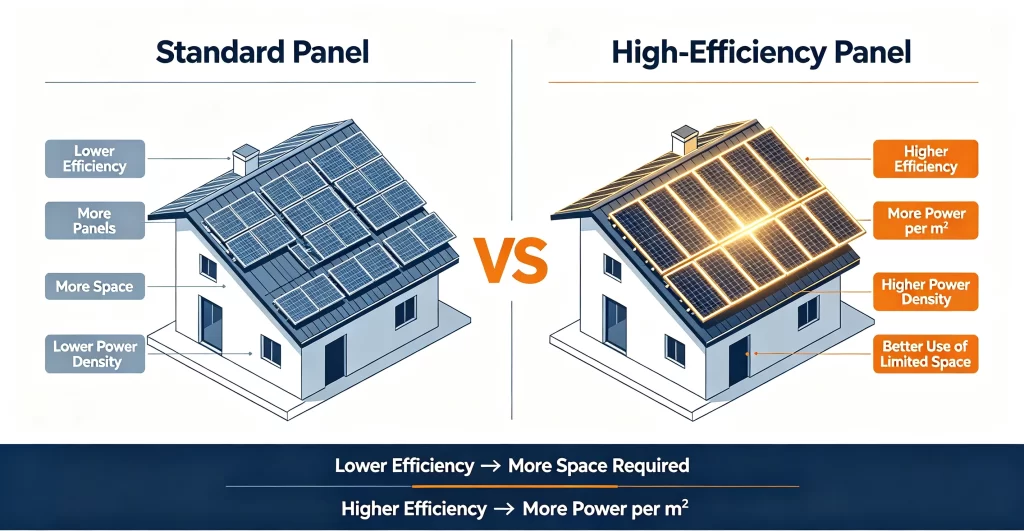
A lower-efficiency module may require more physical area to achieve a target system capacity.
A high-efficiency solar module can potentially achieve the same or greater capacity using fewer panels within the same available space.
This can benefit:
- Residential roofs with limited usable area
- Commercial rooftops
- Projects with land constraints
- Sites with roof obstructions or shading limitations
For space-constrained projects, maximizing energy production per square meter can be more important than simply minimizing the price of each panel.
Higher Energy Yield Can Increase Solar Energy Savings
When system capacity is limited by available space, higher-efficiency modules can enable more installed capacity and potentially greater energy production within the same footprint.
However, higher efficiency does not automatically mean higher ROI.
The additional energy production must be compared with the additional system cost.
That leads to the next step in evaluating high efficiency panel ROI.
How to Compare Additional Cost With Additional Savings
When comparing standard and high-efficiency panels, the key question is not simply which panel costs less. Solar ROI should be evaluated at the system level rather than by comparing panel prices alone.
Instead, compare:
Additional Investment → Additional Energy Production → Additional Annual Savings → Additional Lifetime Value
Suppose a standard solar configuration costs $16,000, while a high-efficiency configuration costs $20,000.
The difference is $4,000.
Rather than treating that $4,000 as an automatic disadvantage, evaluate what the additional investment produces:
- How much additional electricity does the system generate?
- How much additional electricity can be consumed on-site?
- What is the value of exported electricity?
- Does the configuration require fewer modules?
- Can fewer modules reduce mounting, cabling, or installation costs?
- How much additional savings can be generated over the system's operating life?
This is a system-level comparison, not simply a comparison between two panel prices. It provides a more complete basis for evaluating solar ROI over the life of the system.
Why Balance-of-System Costs Matter
Using fewer high-efficiency modules to achieve a target capacity may also affect balance-of-system costs, including:
- Mounting structures
- DC cabling
- Connectors
- Installation labor
- Roof attachment points
The actual impact varies by project, so these costs should be included when comparing different module configurations.
The goal is to determine whether the additional investment produces enough additional energy and financial value to justify the higher upfront cost.
Simple Payback vs. Lifetime Solar ROI
The payback period shows how quickly a solar investment can recover its initial cost, but it does not capture the full financial value of the system over its operating life.
A shorter payback period does not necessarily mean a higher lifetime solar ROI. Payback measures how quickly the initial investment is recovered, while ROI considers the financial value generated relative to the total investment over time.
Once the initial investment has been recovered, the system can continue generating electricity and reducing energy costs. This is where lifetime solar ROI becomes important.
A simplified calculation is:
Lifetime Solar ROI = (Lifetime Solar Benefits − Total Investment) ÷ Total Investment × 100%
Here, total investment may include equipment, installation, financing costs, maintenance, replacement costs, and other applicable project expenses.
A detailed lifetime analysis can account for:
- Lifetime energy production
- Module degradation
- Electricity price changes
- Incentives
- Financing costs
- Maintenance
- Inverter replacement
- Export compensation
As a result, two systems can have similar payback periods but different long-term financial outcomes. A high-efficiency system may require a higher initial investment while producing more electricity over its operating life, potentially generating greater cumulative savings.
This is why evaluating high-efficiency panel ROI requires looking beyond the break-even point and considering the total financial value generated over the system's lifetime. A high-efficiency system may require a higher initial investment, but it can still provide greater long-term value if the additional energy production generates sufficient savings over its operating life.
Practical Solar Payback Calculation Example
Consider two hypothetical residential solar systems installed on the same available roof area:
| Item | Standard System | High-Efficiency System |
|---|---|---|
| Net System Cost | $16,000 | $20,000 |
| Annual Solar Savings | $2,000 | $2,500 |
| Simple Payback | 8.0 years | 8.0 years |
| Available Roof Area | Same | Same |
| Energy Production | Lower | Higher |
Both systems reach simple payback in approximately eight years. At first glance, this may suggest that neither system has a clear financial advantage.
However, the high-efficiency system generates an estimated $500 more in annual savings.
The additional investment is:
$20,000 − $16,000 = $4,000
The additional annual savings are:
$2,500 − $2,000 = $500
This means the additional investment would require approximately:
$4,000 ÷ $500 = 8 years
to recover through the additional savings alone.
After that point, assuming the additional energy production and savings continue, the high-efficiency configuration can generate additional cumulative value.
This illustrates an important principle in high-efficiency panel ROI analysis:
The question is not simply whether high-efficiency panels cost more, but whether the additional energy and financial value justify the additional investment.
Actual results will vary according to electricity rates, energy production, module degradation, financing, maintenance, utility compensation, and other project-specific factors.
How to Maximize Solar ROI
Improving solar ROI is not simply about selecting the panel with the highest efficiency. The goal is not to maximize system capacity alone, but to maximize the financial value generated by each dollar invested.
The entire system should be optimized around energy production, electricity consumption, available space, and long-term financial value.
Optimize System Size
System capacity should reflect actual electricity consumption, available installation space, utility rules, and financial objectives.
Oversizing may not always improve ROI if excess electricity receives a lower compensation rate.
Use High-Efficiency Panels Where Space Is Limited
High-efficiency modules are particularly valuable when roof or land area is constrained.
The objective is to maximize useful energy production from the available installation footprint.
Increase Self-Consumption
Using solar electricity directly can improve its financial value under certain utility rate structures.
Load shifting, smart energy management, and battery storage can help align solar production with electricity demand.
Evaluate Battery Storage Carefully
Battery storage can capture excess solar generation for later use, but its financial value depends on battery cost, electricity rates, export compensation, operating strategy, and the value of backup power.
Storage should therefore be evaluated as part of the complete project economics.
Monitor System Performance
Ongoing monitoring can identify production losses caused by equipment faults, shading, wiring problems, or other issues.
Maintaining expected system performance helps protect projected solar energy savings over time.
Incentives Should Be Based on Current Rules
Solar incentives can reduce the effective upfront cost of a project and improve its financial profile. However, eligibility, credit rates, program requirements, and expiration dates vary by location and installation date.
For U.S. residential projects, the federal Residential Clean Energy Credit provided a 30% credit for qualifying expenditures through December 31, 2025. According to the IRS, the credit is not available for qualifying property placed in service after December 31, 2025.
Therefore, a solar payback calculation should use incentives that are actually available for the specific project rather than relying on historical tax-credit assumptions. Homeowners and businesses should verify current federal, state, local, and utility incentives before estimating project costs, payback periods, or lifetime ROI.
The Bottom Line: Payback Is the Starting Point, Not the Final Answer
A solar payback calculation estimates how quickly a solar investment can recover its initial cost, but long-term ROI also depends on energy production, annual savings, system costs, and lifetime performance.
High-efficiency panels can improve project economics by generating more power within the same space, but their additional cost should always be evaluated against the expected financial benefits.
For homeowners and businesses evaluating solar investments, choosing the right combination of module efficiency, system design, and energy management can make a meaningful difference in long-term financial performance. Sunpal provides high-efficiency solar solutions designed to support these project goals.